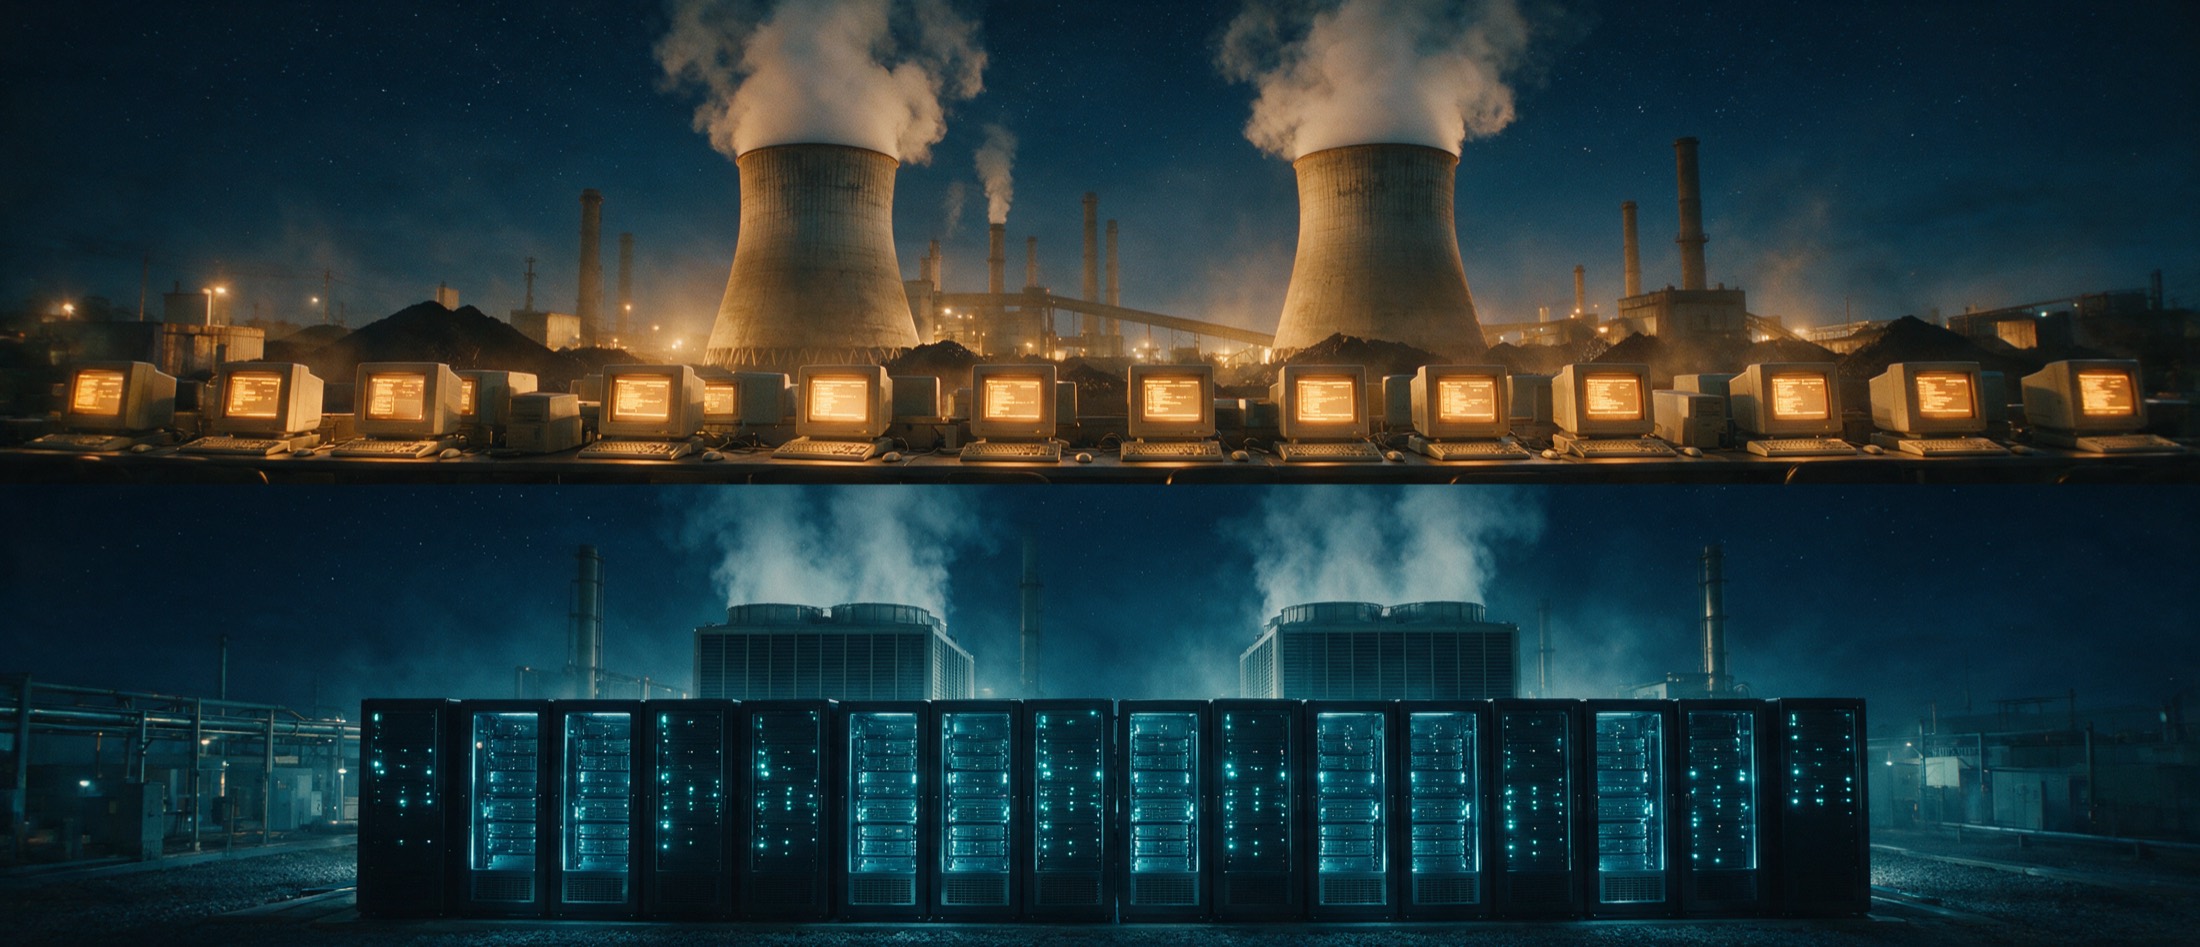
The same scene twice: above, 1999 coal cooling towers behind a row of glowing beige CRT terminals; below, the identical composition in 2026 with data-hall cooling units behind a row of cyan-lit server racks.

Position Paper  /  August 2026

Two Electricity-Demand Panics, Twenty-Five Years Apart

A comparative analysis of the 1990s Internet electricity forecasts and the 2020s artificial intelligence and data center forecasts, with an inference-economics critique

Gaiergy Corp, New York City

Scroll
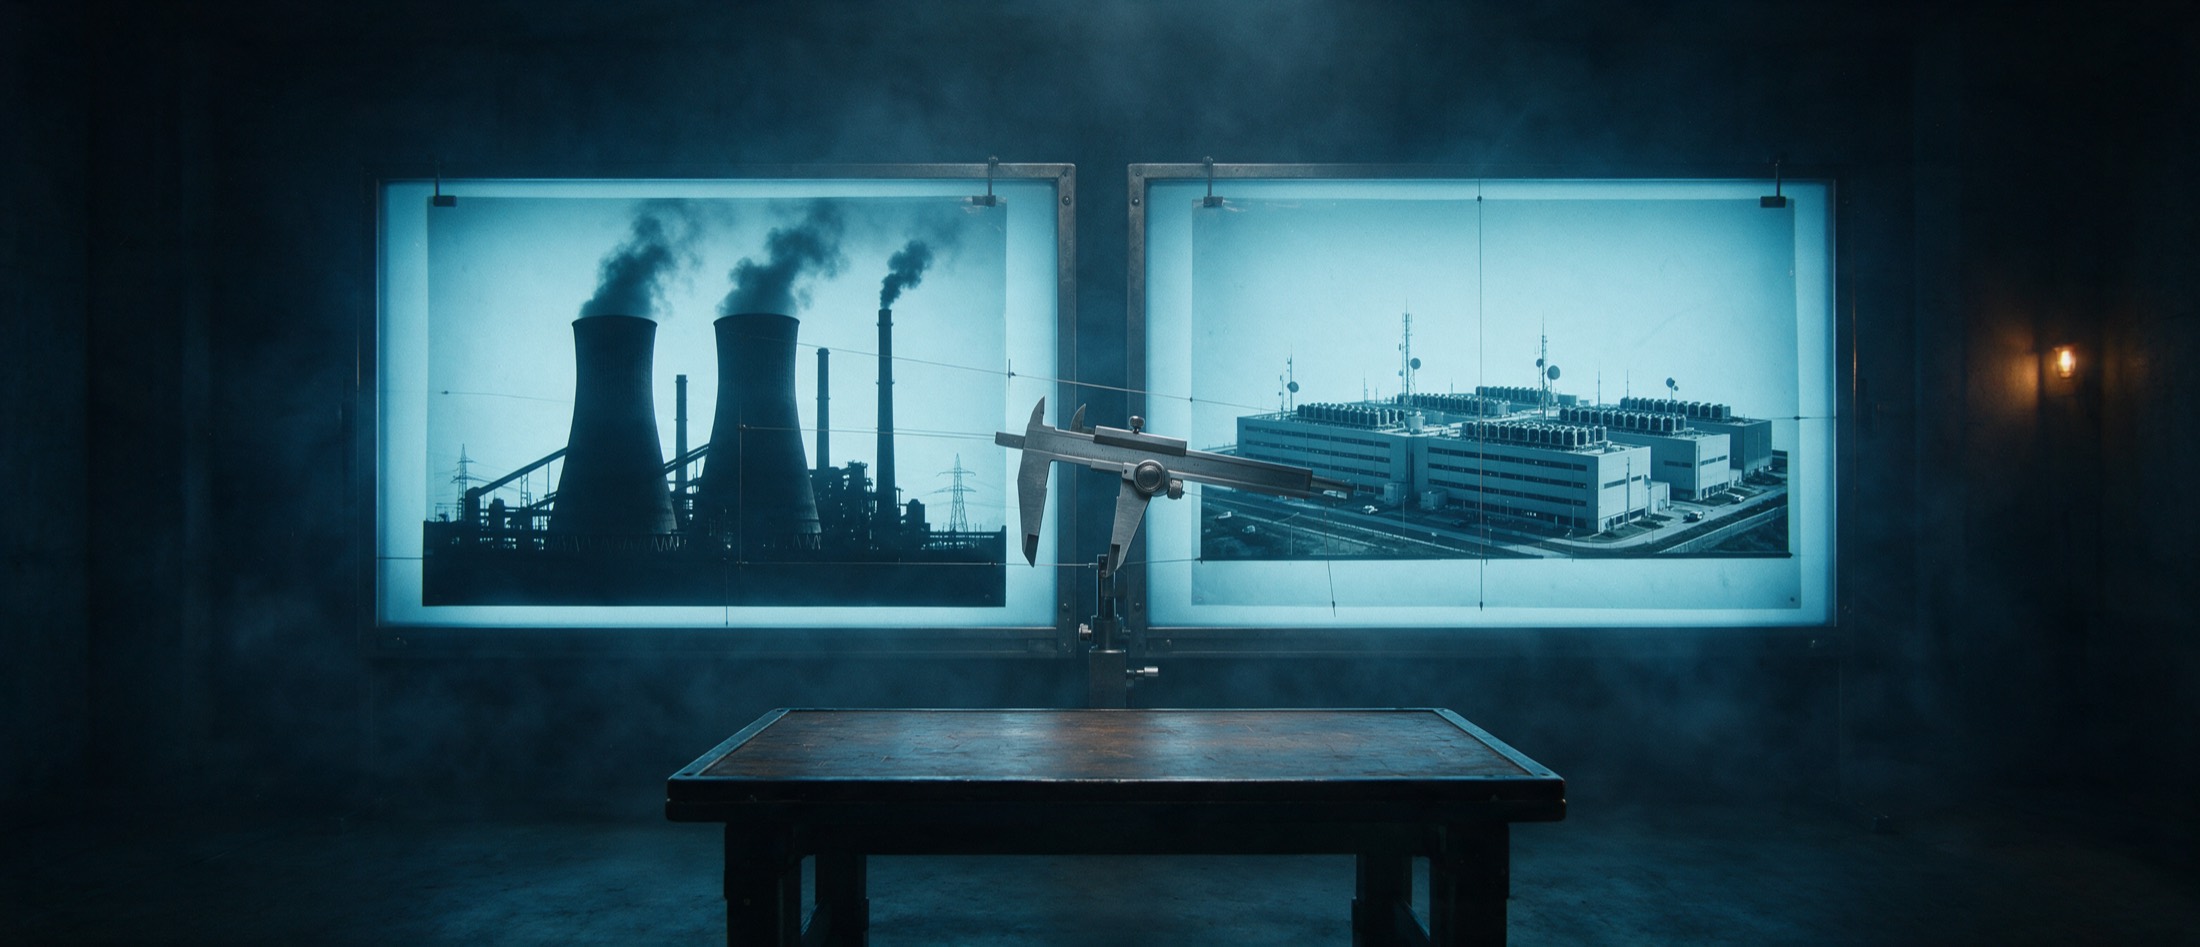
A forensic examination room with two backlit transparencies side by side, a 1990s coal plant and a modern data centre campus, with calipers and measuring threads spanning between them.
Purpose

One question,
asked plainly

Are the 2020s forecasts of artificial intelligence and data center electricity demand repeating the failure of the 1990s Internet electricity forecasts?

This paper answers it in three moves. What was claimed in 1999, and what actually happened. What is being claimed now, and who is claiming it. Then a specific thesis: that today's capital is modeled on training economics while the durable economics live in inference, that inference is migrating to the periphery, and that competition is forcing a race to the bottom on inference cost that rewards efficiency, and therefore lower power per useful task.

Every figure in this document is sourced at the point of use. Numbered references link to the sources at the end.

Read this first

Five conclusions

Everything after this section is the evidence behind them.

01

The miss

The 1990s forecast did not miss by a little. It missed by more than an order of magnitude.

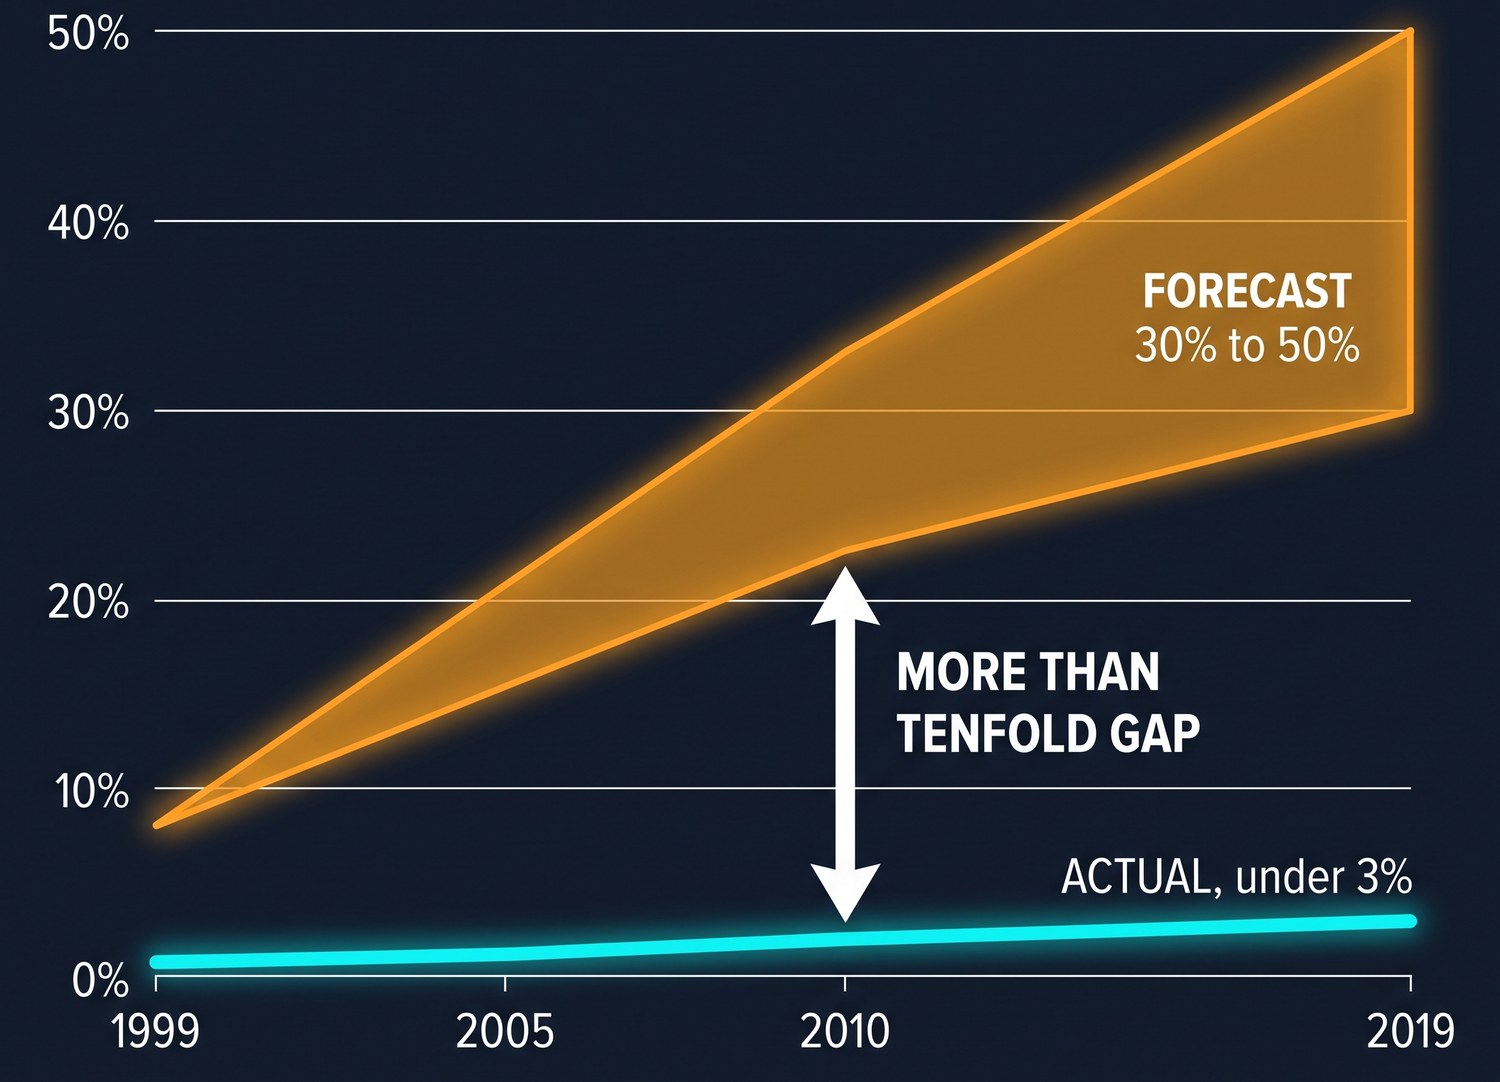
In 1999 it was claimed that the Internet already took roughly 8 percent of United States electricity and would need 30 to 50 percent within one to two decades. The corrected figure put the Internet itself at well under 1 percent, and all office, telecommunications and network equipment combined at roughly 3 percent.

Huber and Mills, Forbes, May 31, 1999 (Note 1); Mills, Greening Earth Society, May 1999 (Note 2); Koomey, Lawrence Berkeley National Laboratory LBNL-46509, August 2000 (Note 3).

Chart. An amber wedge begins at 8 percent in 1999 and widens to a band of 30 to 50 percent of United States electricity by 2019, labelled forecast. A thick cyan line runs almost flat along the bottom from under 1 percent to about 3 percent, labelled actual, under 3 percent. A white double-headed arrow marks the gap, labelled more than tenfold gap.

Forecast: 30 to 50 percent of United States electricity within one to two decades (Notes 1, 2). Measured: under 1 percent for the Internet itself, roughly 3 percent for all office, telecommunications and network equipment (Note 3), and 1.7 to 2.2 percent for United States data centers in 2010 (Note 7). Intermediate years are drawn as a smooth path between sourced endpoints and are not themselves published values.

02

The reason

It failed for a structural reason, not a clerical one. Efficiency outran demand.

Better chips, better data center design and virtualization, together with the effects of the 2008 financial crisis, closed the gap. United States data center electricity use grew only about 36 percent from 2005 to 2010, against a previously projected doubling.

Koomey, "Growth in Data Center Electricity Use 2005 to 2010," Analytics Press, August 1, 2011 (Note 7); Masanet et al., Science, February 28, 2020 (Note 8).

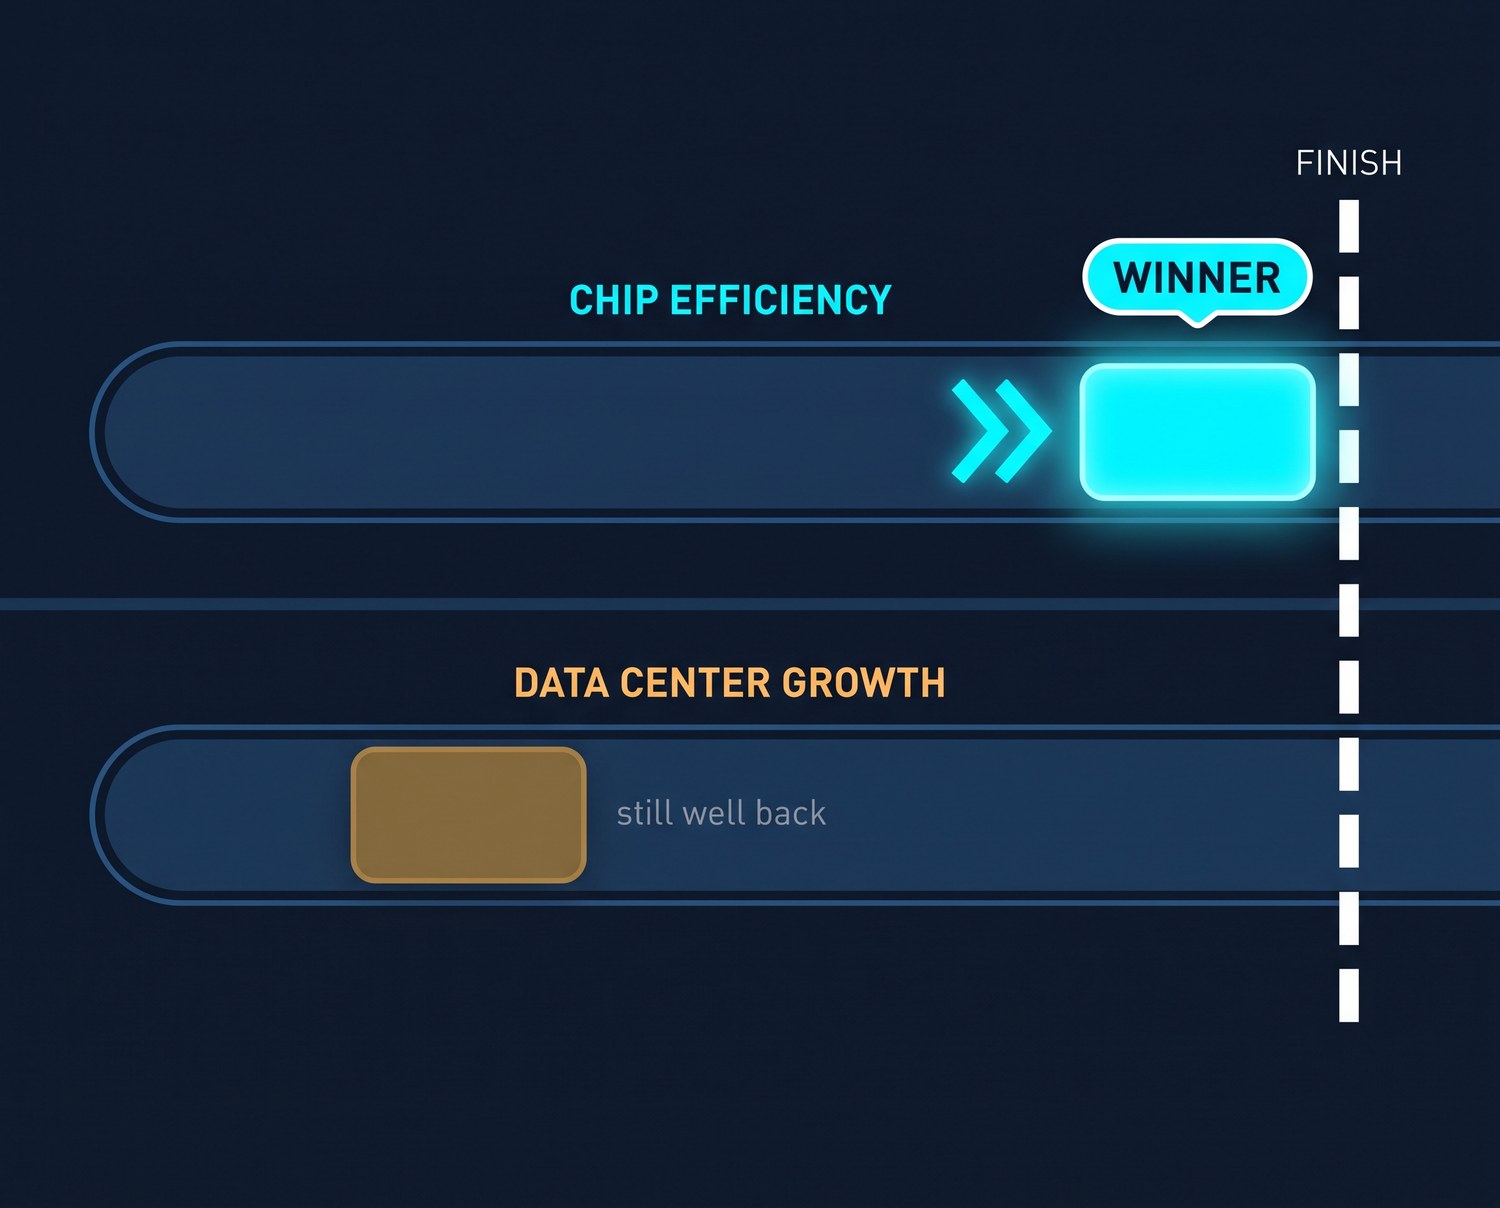
A two-lane race seen from above. The upper lane, labelled chip efficiency, has a glowing cyan block at the finish line with a winner badge. The lower lane, labelled data center growth, has an amber block only a third of the way along, marked still well back.

Race framing is a device, not a measured series. The sourced result: United States data center electricity use grew about 36 percent from 2005 to 2010 against a projected doubling (Note 7), while compute demand rose far faster than energy use over the following decade (Note 8).

03

The difference

Today's forecasts are genuinely better built. That is a real difference, and it should be stated plainly.

The 1999 claim came from advocates with a commercial interest in the conclusion, published in the popular and financial press. Today's numbers come from a national laboratory bottom-up study and from the bodies below. They start from a measured baseline of roughly 4.4 percent of United States electricity, and they are expressed as scenario ranges rather than a single alarming figure.

Shehabi et al., LBNL-2001637, December 2024 (Note 9); International Energy Agency, April 2025 (Note 10); Energy Information Administration, 2026 outlooks (Note 11); Electric Power Research Institute, 2024 (Note 12).

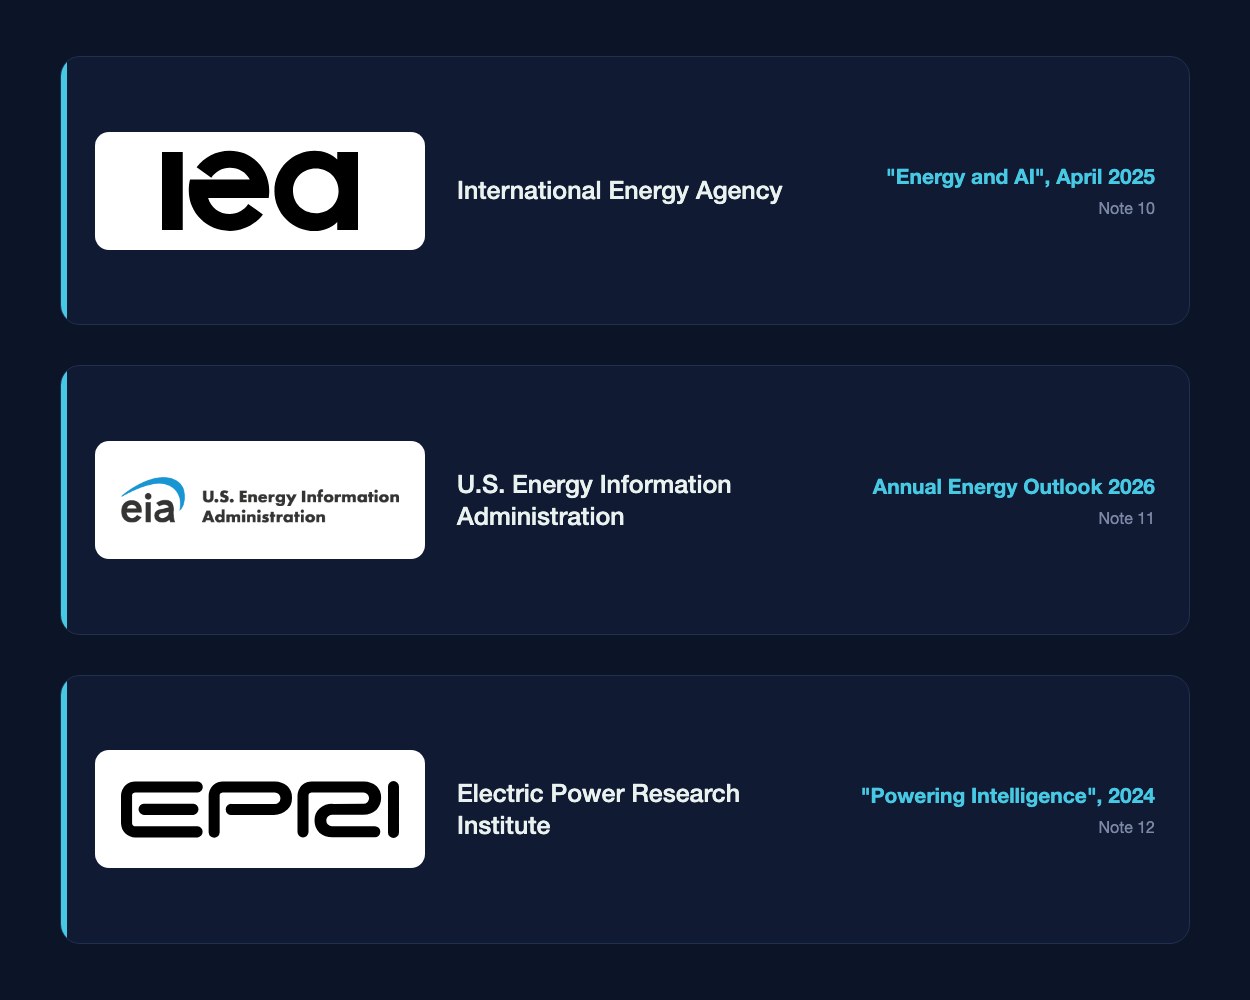
Three source cards carrying the official logos of the International Energy Agency, the United States Energy Information Administration and the Electric Power Research Institute, each with the publication cited in this paper and its note number.

Logos are each organization's own official mark, retrieved from iea.org, eia.gov and epri.com on August 3, 2026, and reproduced unaltered solely to identify the bodies whose work is cited. No endorsement is implied. Each card names the body and the publication cited in this paper (Notes 10, 11, 12).

04

The mismatch

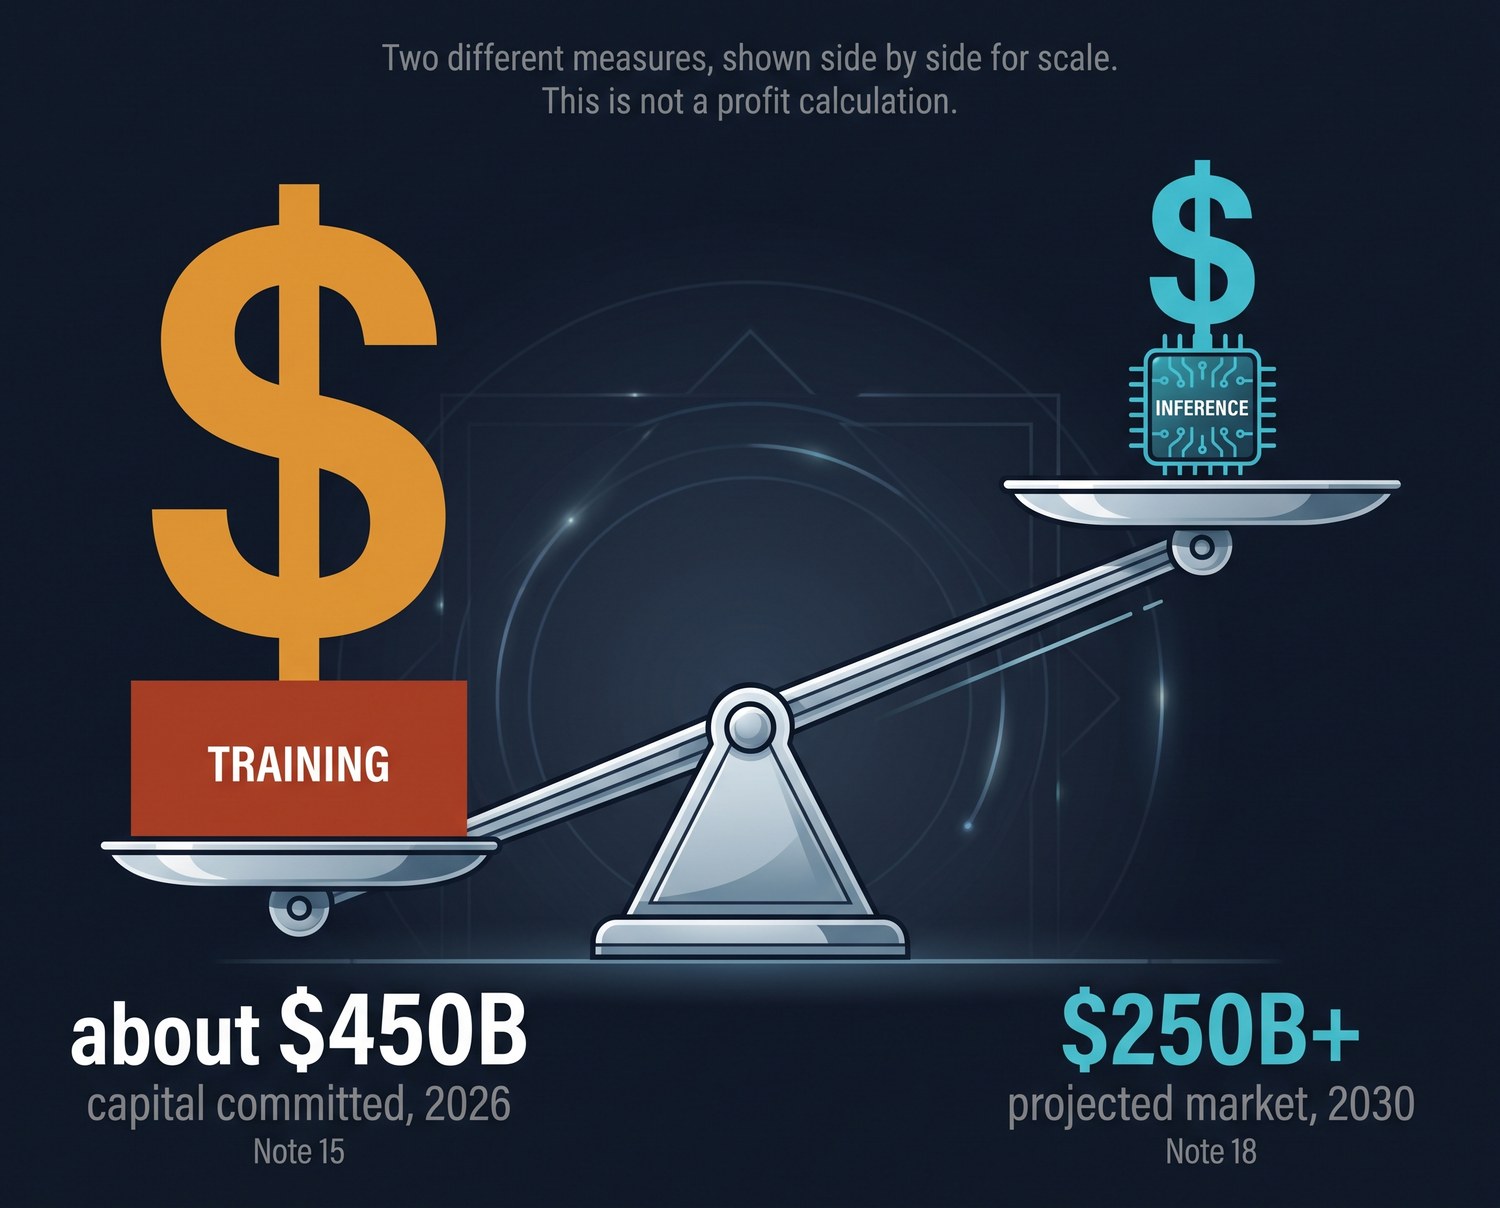
The capital is committed on training economics, but the durable economics live in inference.

Inference accounts for 80 to 90 percent of the lifetime compute cost of a production system. Inference cost for output of the quality of GPT-3 has fallen by roughly three orders of magnitude in about two years, and inference is migrating to lower-power edge silicon. That is the same efficiency dynamic that broke the 1990s forecast.

Introl, 2025 (Note 17); Introl, January 2026 (Note 15); Adebayo, Forbes, October 29, 2025 (Note 18); SemiAnalysis, 2025 (Note 19).

A beam balance tipped down to the left. The left pan carries a large amber dollar sign over a block labelled training, marked about 450 billion dollars of capital committed for 2026. The raised right pan carries a smaller cyan dollar sign over a chip labelled inference, marked 250 billion dollars plus projected market for 2030.

Left: roughly $450 billion of 2026 hyperscaler capital expenditure tied to artificial intelligence infrastructure (Note 15). Right: the inference market projected to exceed $250 billion by 2030 (Note 18). These are different measures, annual capital spending against a projected annual market, shown together for scale only. The tilt of the beam is illustrative.

05

The answer

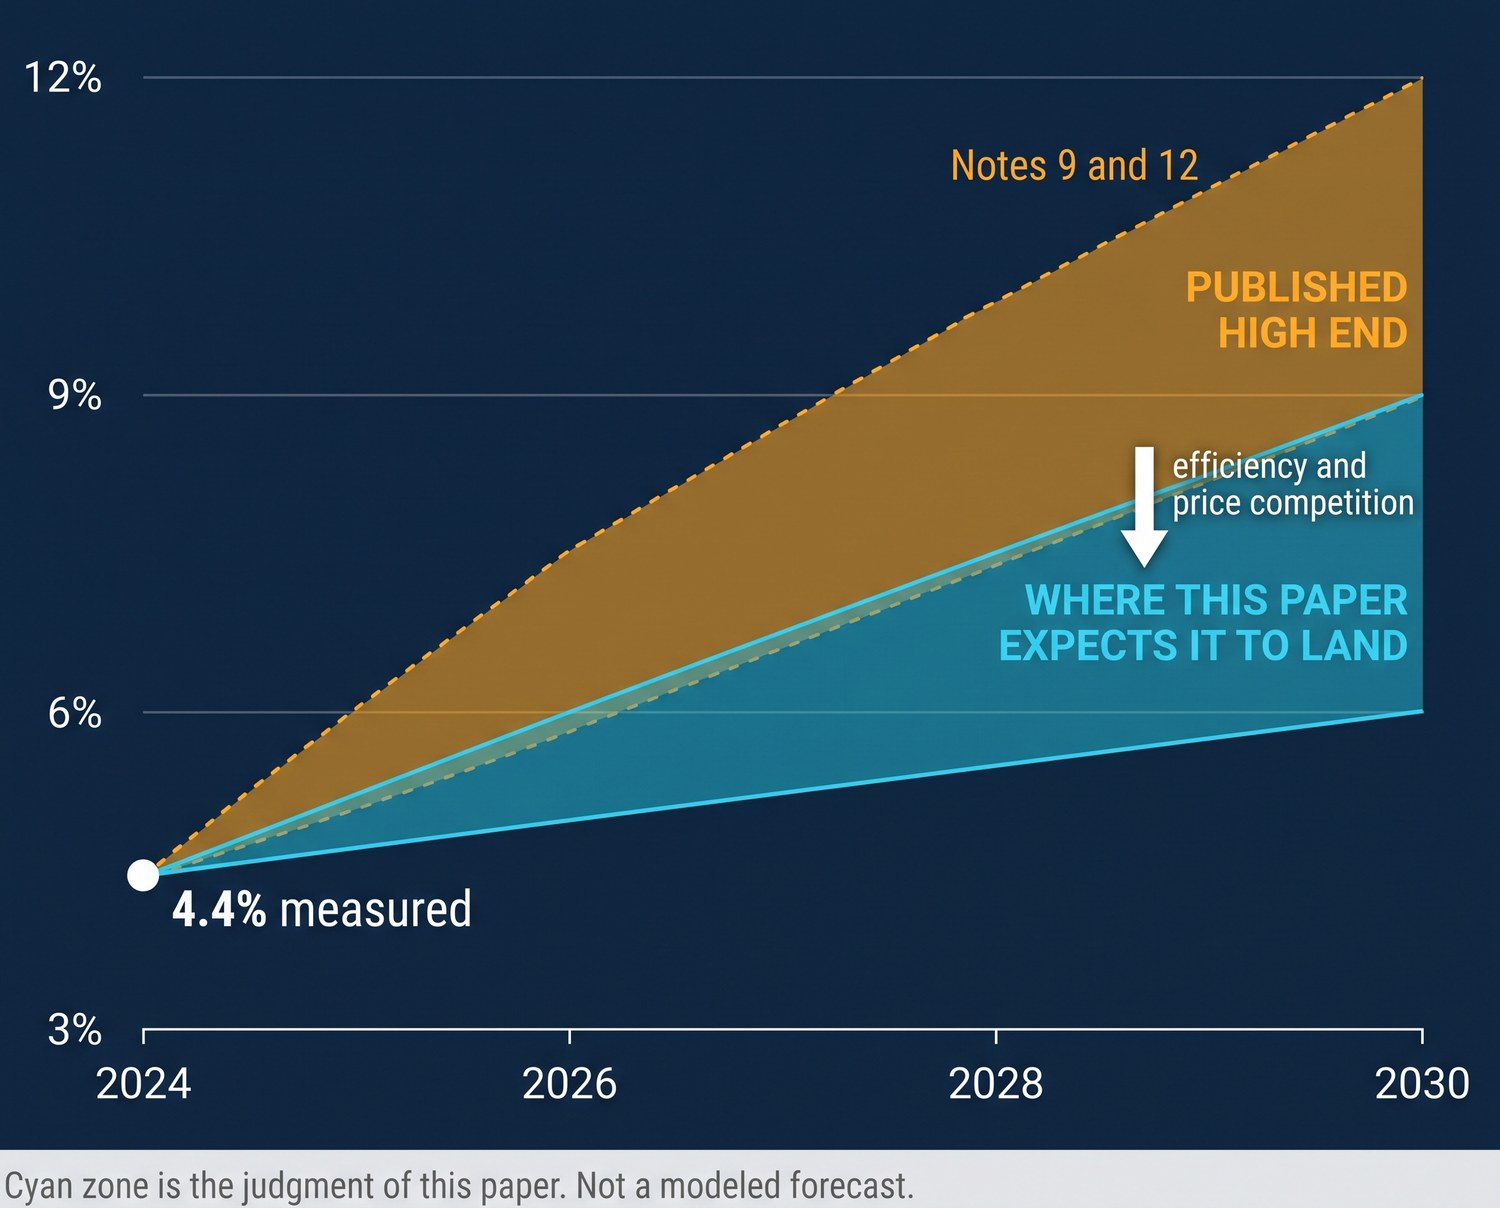
The honest answer is a distribution, not a number. Expect real growth, and expect the high end to overshoot.

The strongest counterargument to the efficiency case is the Jevons paradox, under which cheaper inference expands total usage enough to lift aggregate demand. That is a genuine open question, and it is why this paper does not offer a point forecast. The likeliest outcome sits between the extremes: real and substantial growth, with the highest-end projections overshooting.

Shehabi et al., LBNL-2001637 (Note 9); Electric Power Research Institute, 2024 (Note 12); Koomey and Schmidt, Bipartisan Policy Center, 2025 (Note 13); National Center for Energy Analytics, 2025 (Note 25). The expectation shown is the judgment of this paper, stated as such.

Chart from 2024 to 2030. A white dot marks 4.4 percent measured in 2024. A broad amber band fans upward to about 12 percent by 2030, labelled published high end. A narrower cyan band stays lower, reaching about 6 to 9 percent, labelled where this paper expects it to land, with a downward arrow marked efficiency and price competition.

Measured 2024 baseline and the 6.7 to 12 percent range for 2028 are from Shehabi et al. (Note 9); the above 9 percent 2030 scenario is from EPRI (Note 12). The cyan zone is the judgment of this paper (Note 13 framing), not a modeled forecast, and asserts no probability.

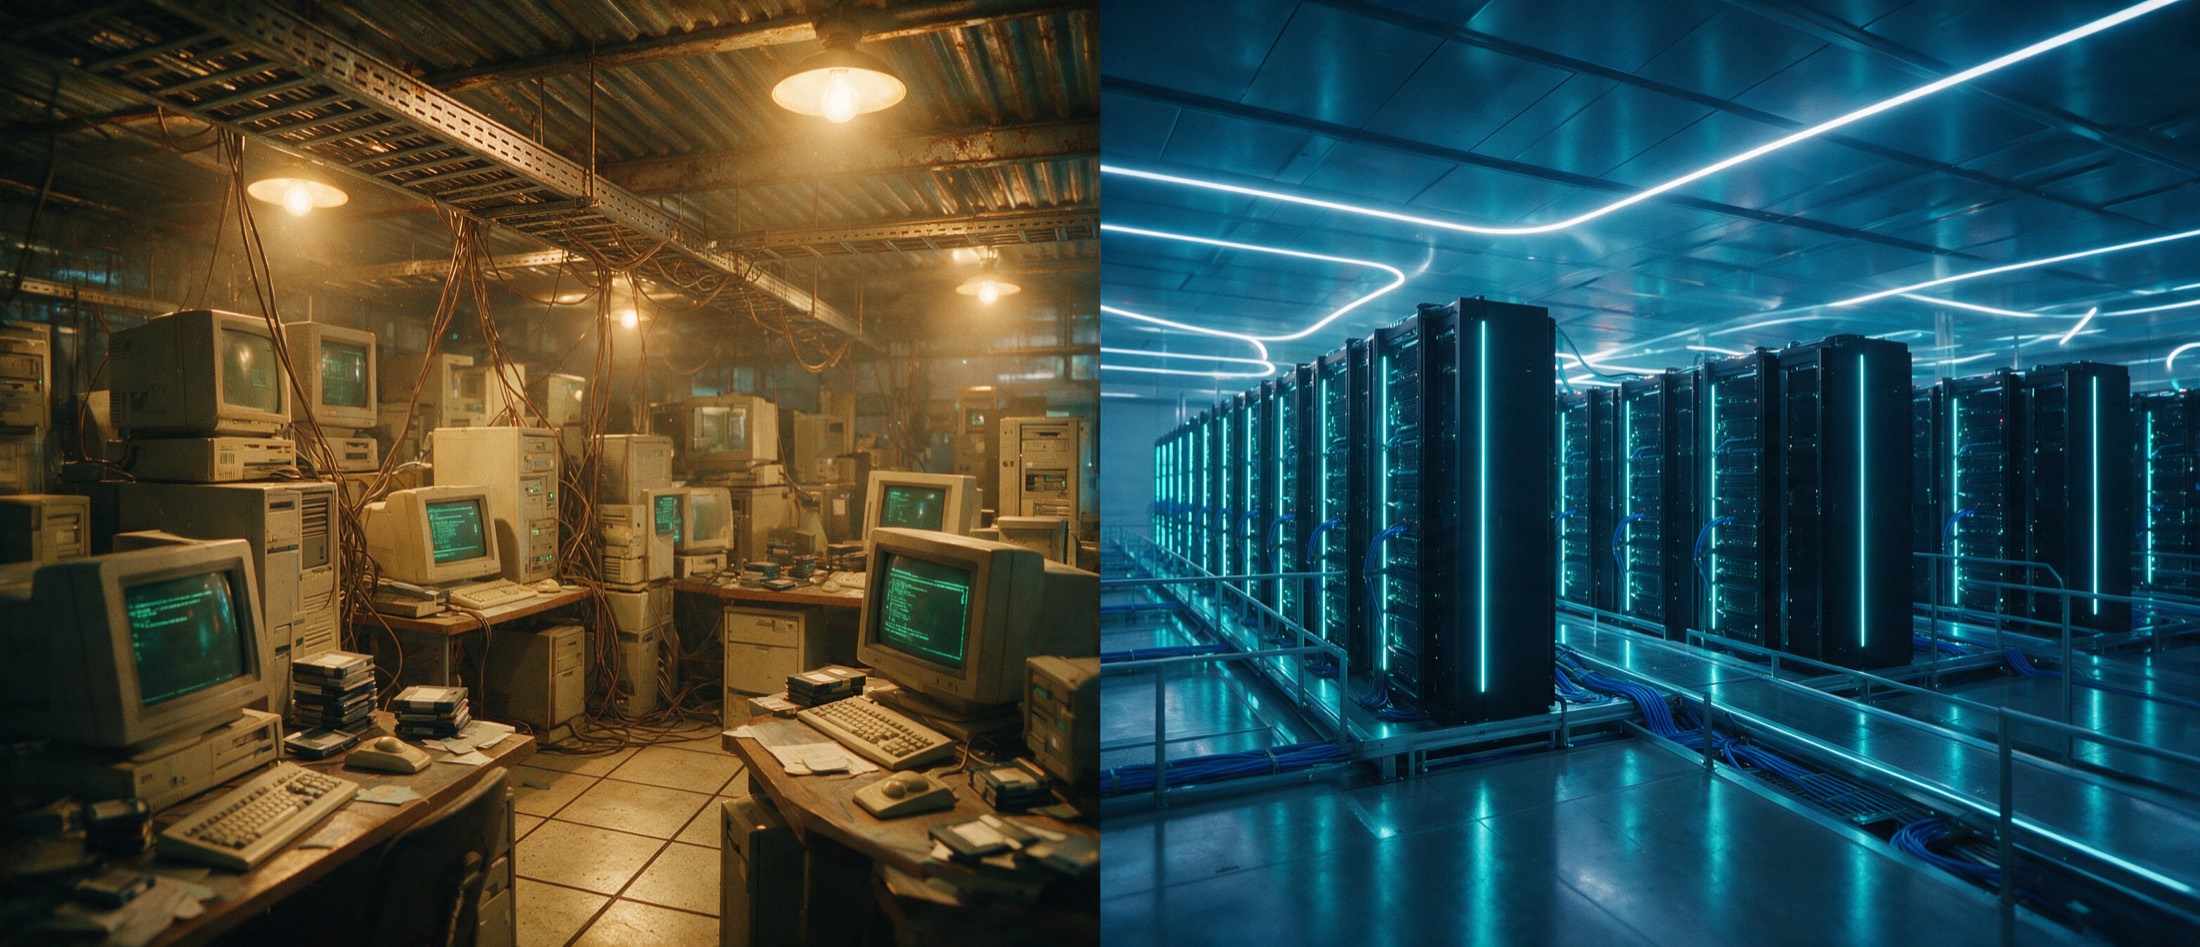
Split image: a 1990s computer room in warm amber light on the left, a modern cyan-lit data hall on the right.
Overview

Twenty-five years apart, the same shape of claim

Two episodes of forecasted electricity demand driven by information technology: the late-1990s claim that the Internet would consume a large share of United States electricity, and the 2024 to 2026 claim that artificial intelligence and data centers will do the same.

The central finding is that the 1990s forecasts failed by more than an order of magnitude, and they failed for a structural reason, efficiency gains outran demand growth. The present forecasts are better grounded, being produced by national laboratories and grid operators rather than op-ed writers, and they start from measured baselines. However, the same efficiency dynamic is already visible in inference, which strengthens the case that the highest-end demand scenarios are likely to overshoot.

The four numbers that frame it

Where this argument starts

30% to 50%
Share of United States electricity the Internet was forecast to require within one to two decades, as claimed in 1999
Huber and Mills, Forbes, May 31, 1999 (Note 1)
Under 1%
Corrected estimate of the Internet's own share of United States electricity at the time of that claim
Koomey, LBNL-46509, August 2000 (Note 3)
4.4%
Measured United States data center share of national electricity, 2023 to 2024, on 176 to 183 terawatt-hours
Shehabi et al., LBNL-2001637, December 2024 (Note 9)
80% to 90%
Inference share of the lifetime compute cost of a production artificial intelligence system
Introl, 2025 (Note 17)
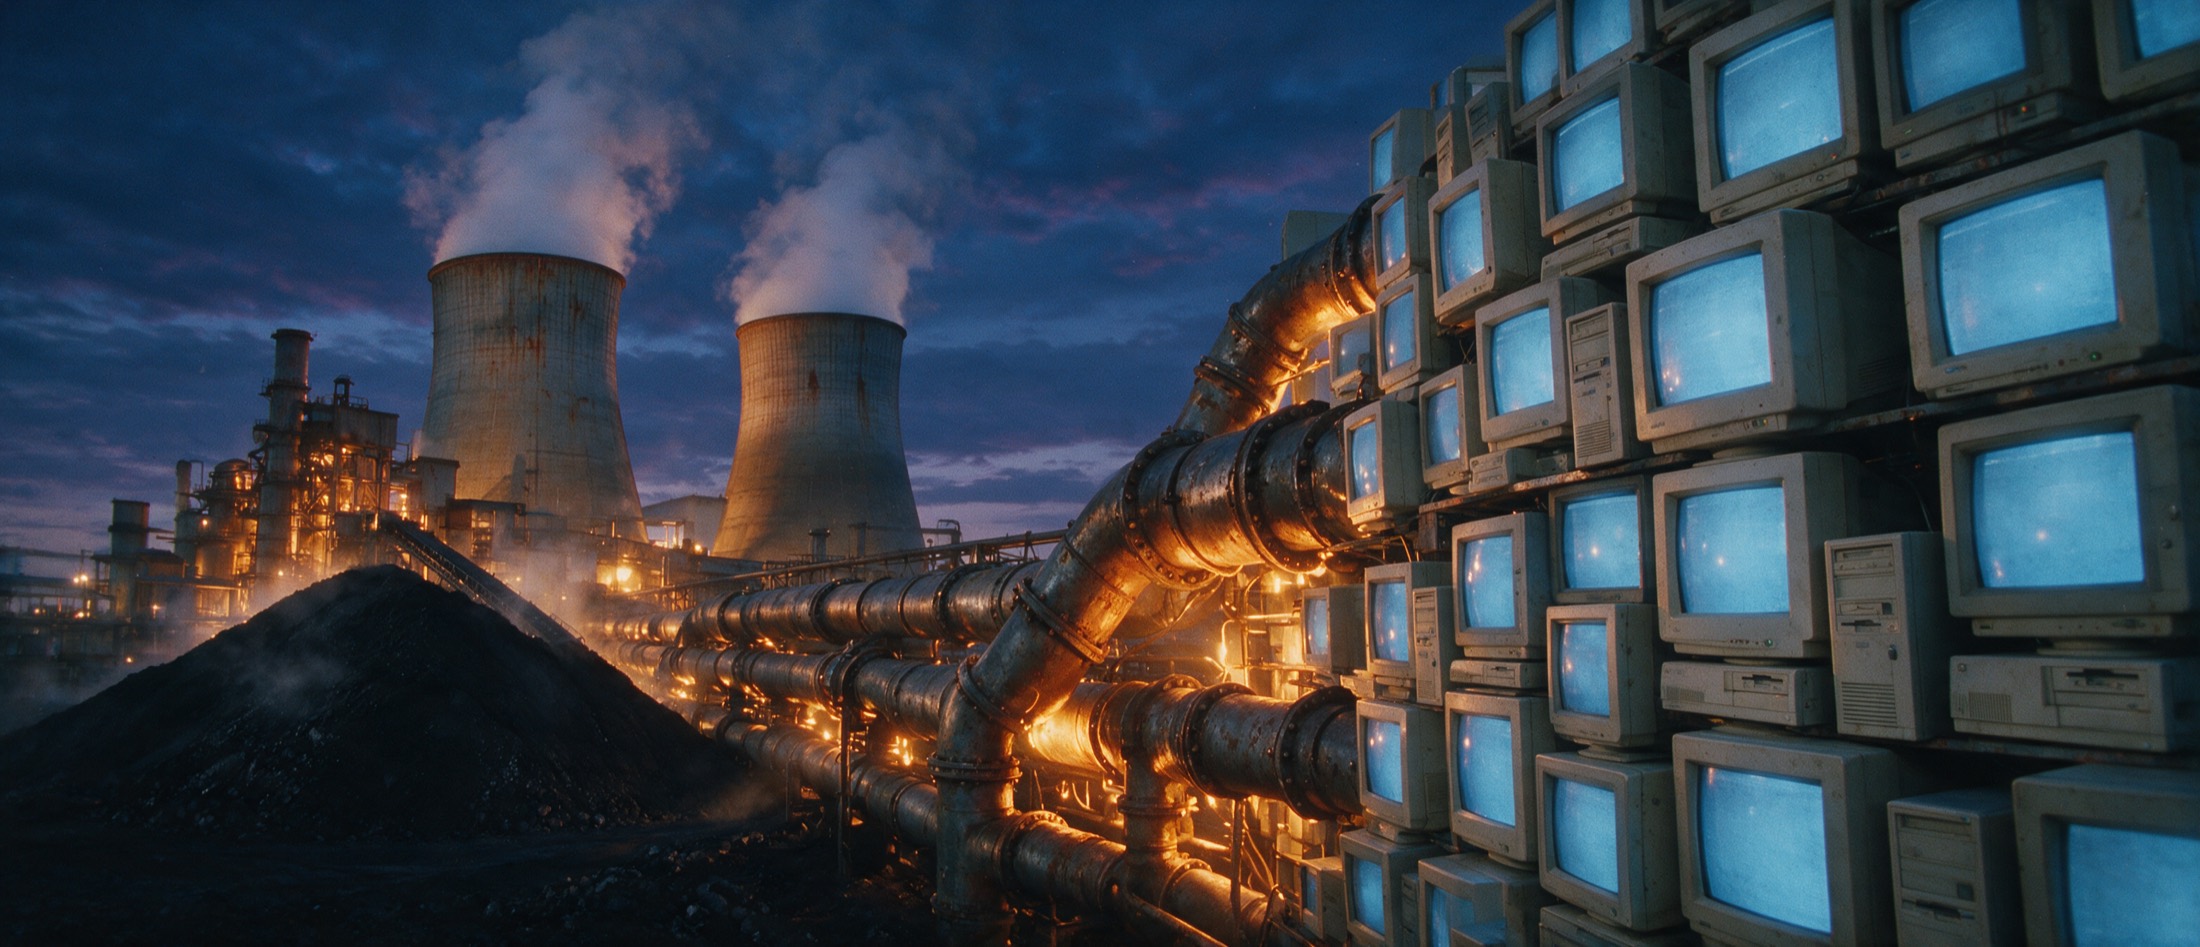
A coal-fired power station and coal stockpile with glowing industrial conduits running directly out of it into the backs of a dense wall of beige 1990s CRT monitors.
Part One

The 1990s Internet electricity forecast

A claim published in the financial press, supported by a report from a group funded by coal interests, and framed explicitly around a need for new coal-fired generation.

The claims

What was actually asserted

The primary source is Peter Huber and Mark P. Mills in Forbes, May 31, 1999.1 It was supported by a longer report by Mark P. Mills, published by the Greening Earth Society, a group funded by coal interests, in May 1999.2

The headline claims were twofold. First, that the Internet and Internet-related equipment already consumed roughly 8 percent of United States electricity in 1998 to 1999. Second, that within one to two decades, 30 to 50 percent of the nation's electricity supply would be required to meet the direct and indirect needs of the Internet. The framing was explicitly that new coal-fired generation would be required to keep pace.12

Who was speaking, and why it matters. The supporting report was published by the Greening Earth Society, a group funded by coal interests, and the framing of the claim was that new coal-fired generation would be required. The interest of the source is part of the record, not an aside. Source: Note 2, as characterized in the underlying position paper.
A beige 1990s desktop computer with a blank glowing screen beside a heap of black coal.
The headline

"Dig more coal, the PCs are coming"

That was the title of the 1999 Forbes article. The argument tied the growth of the Internet directly to a need for new coal-fired generation.

Huber and Mills, Forbes, May 31, 1999, pp. 70 to 72 (Note 1); Mills, Greening Earth Society, May 1999 (Note 2).

The rebuttal literature

It was challenged immediately, and in detail

The claims were challenged rapidly and repeatedly by Jonathan Koomey and colleagues at Lawrence Berkeley National Laboratory. The formal annotated rebuttal to Mills' congressional testimony appeared in August 2000.3 A peer-reviewed bottom-up study followed in the journal Energy in 2002.4 Amory Lovins of Rocky Mountain Institute also engaged Mills directly in a documented 1999 exchange.5

Their conclusion was that Mills had overestimated electricity use, in some cases by more than an order of magnitude.3 The corrected figures showed the Internet itself using well under 1 percent of United States electricity, and all office, telecommunications and network equipment combined using roughly 3 percent. The methodological errors, including conflation of embedded and direct energy and a misread of a 1996 office-equipment paper, were later catalogued in detail.6

Diagram A

The size of the miss

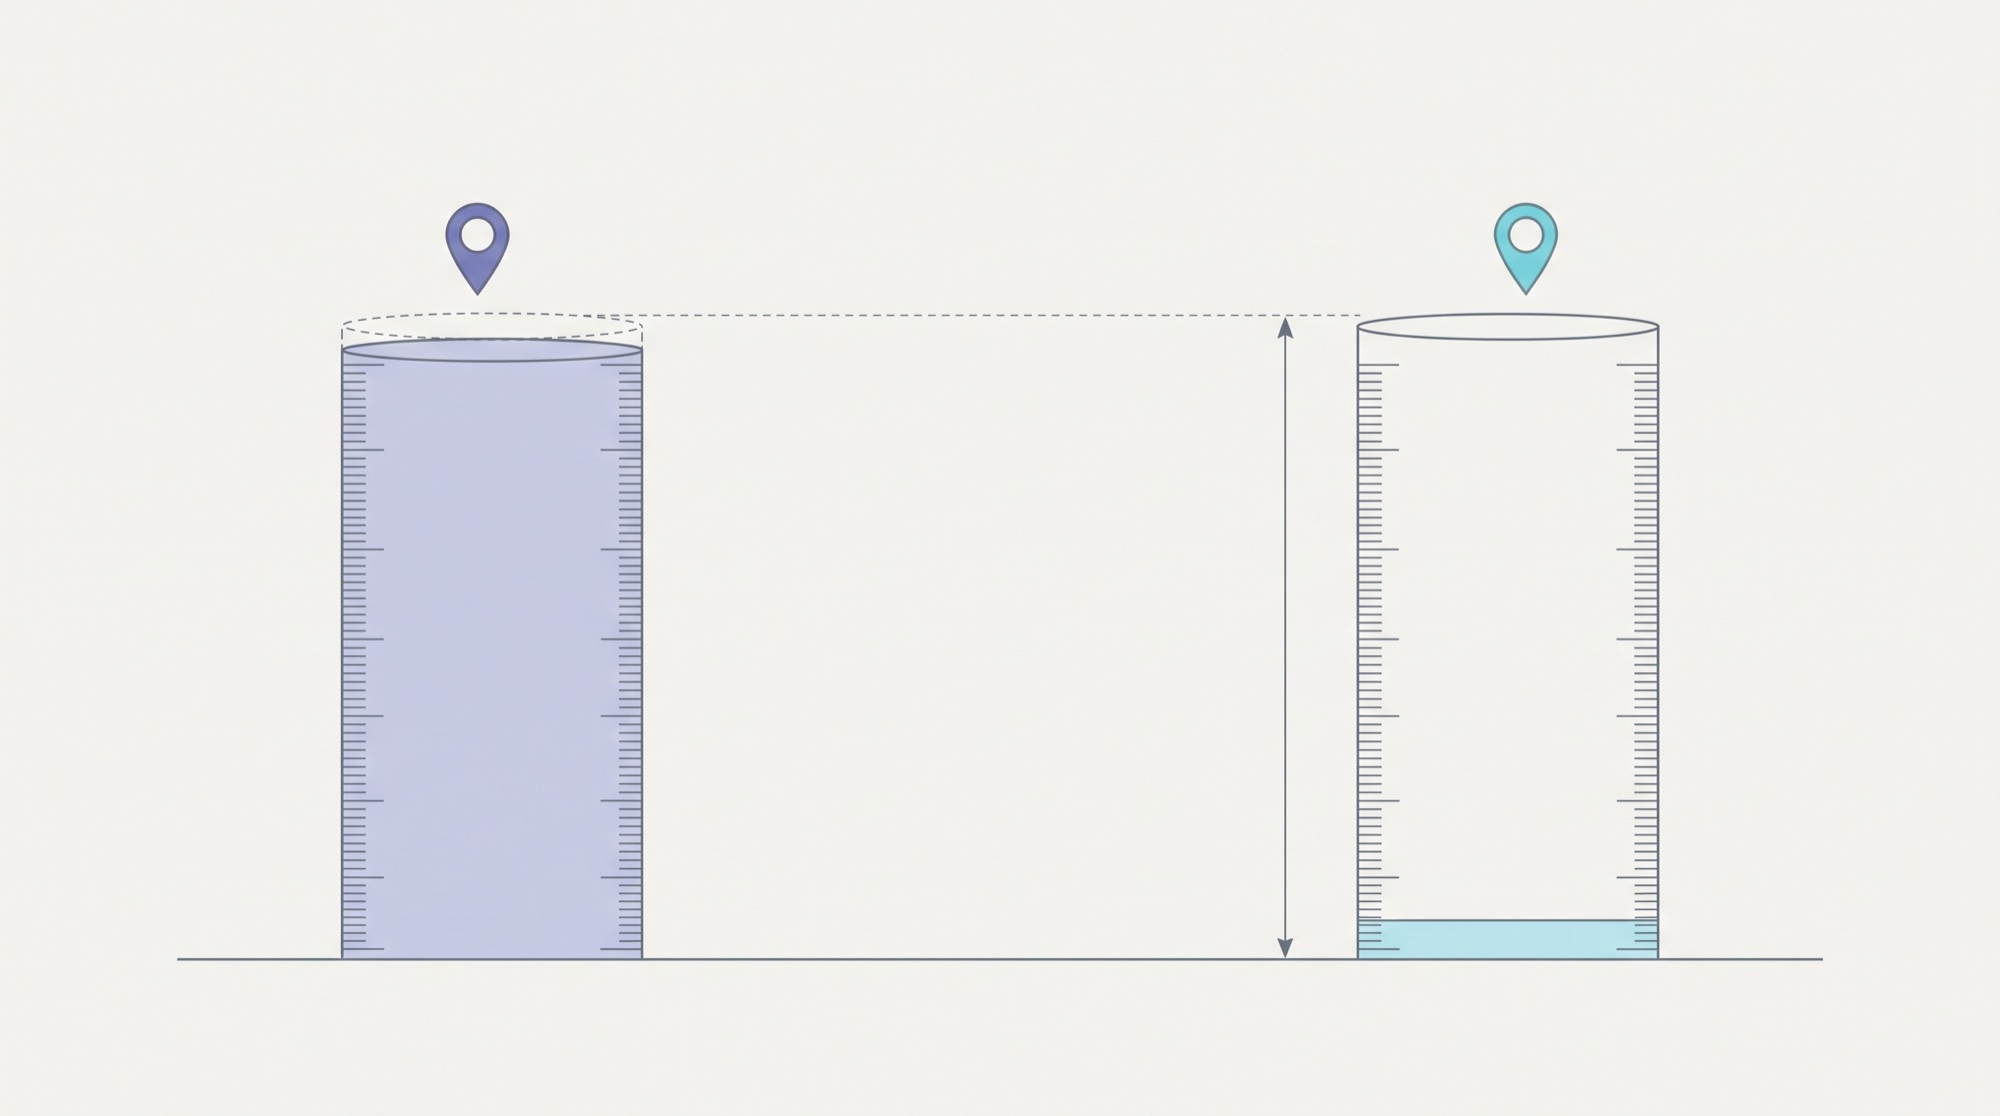
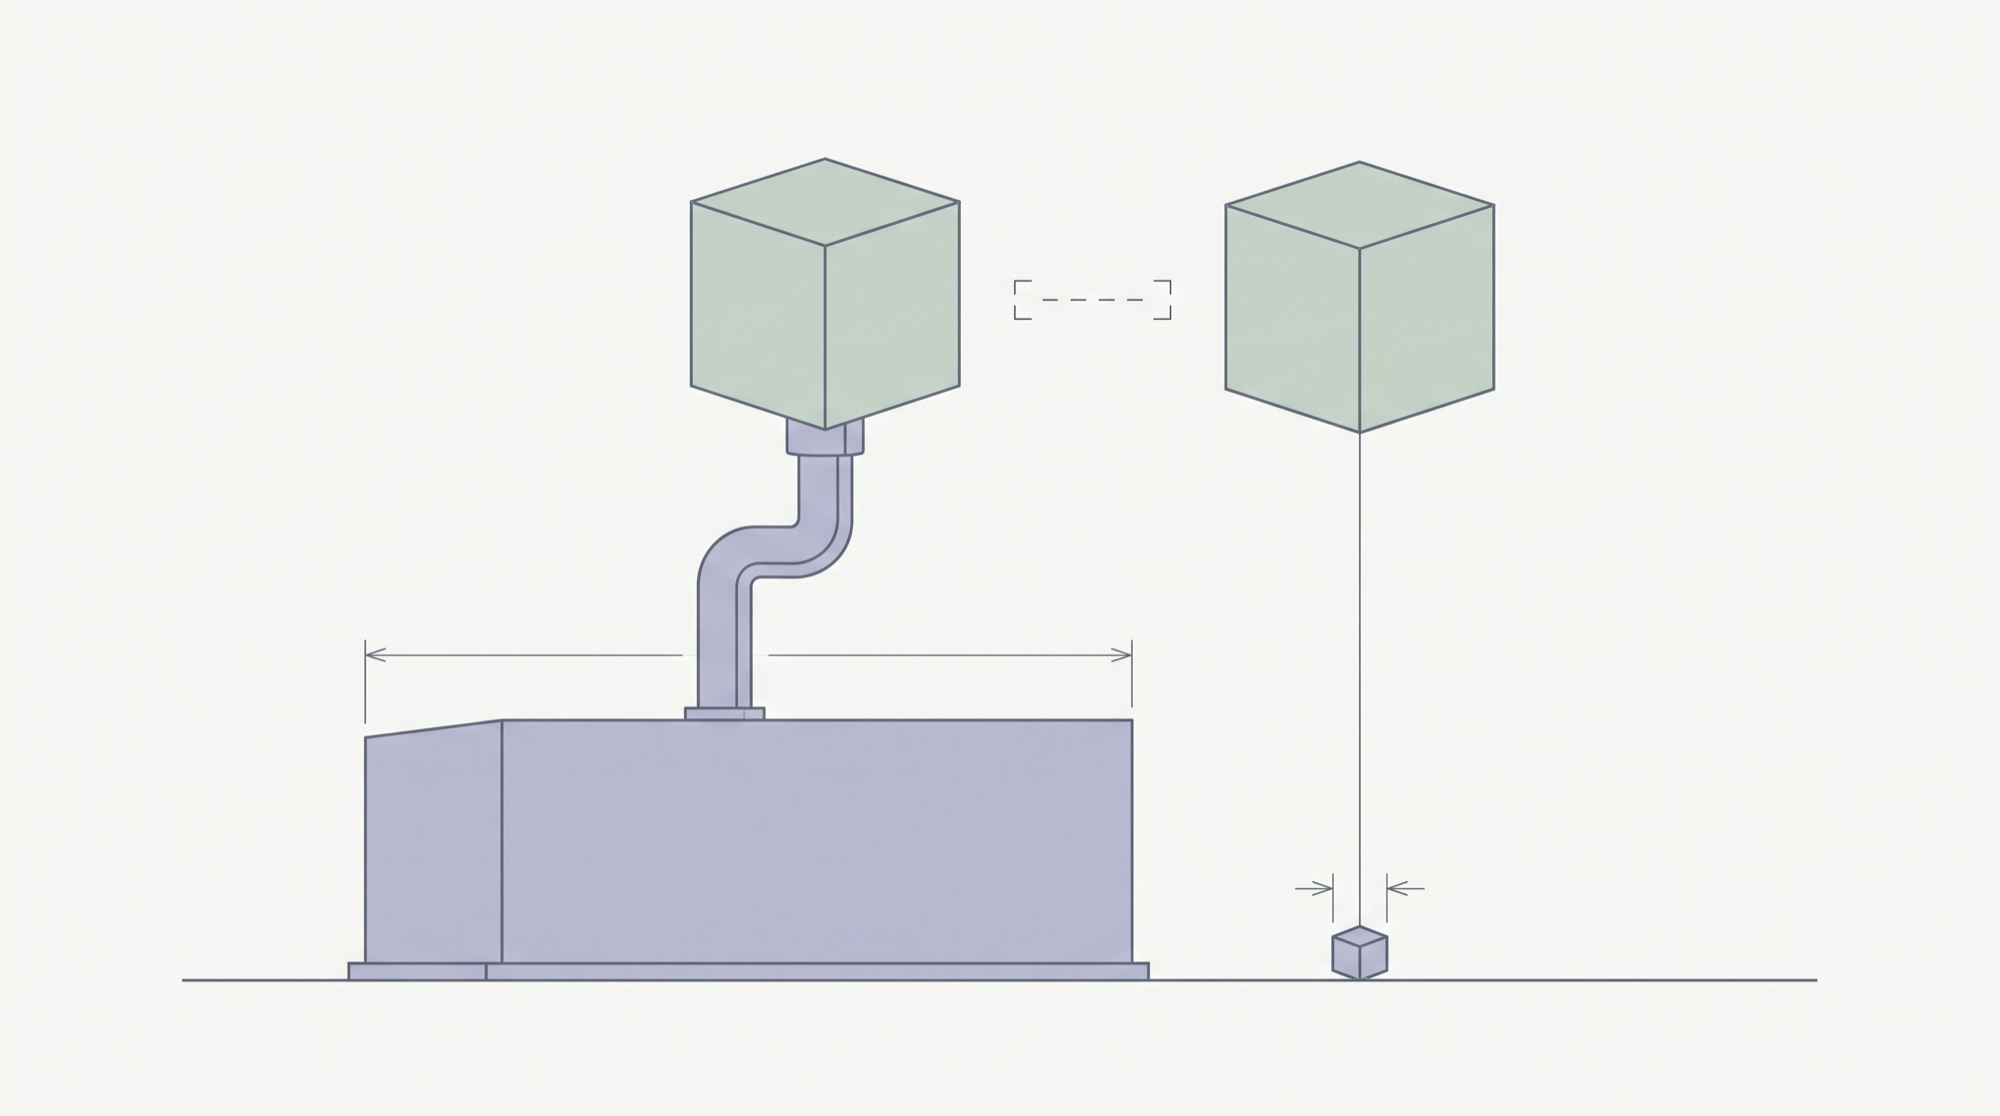
Two identical vessels, one filled to the level that was forecast, one filled to the level that was measured

Two identical tall vessels stand side by side on a shared baseline. The left vessel is filled almost to the top. The right vessel holds only a shallow layer at the very bottom. A vertical dimension arrow spans the large gap between the two fill levels.
Schematic, drawn to no scale. The two vessels are identical so that only the fill levels differ. Forecast level: 30 to 50 percent of United States electricity within one to two decades (Note 1, Note 2). Measured level: the Internet itself well under 1 percent, and all office, telecommunications and network equipment combined roughly 3 percent (Note 3). Figure 1 below plots these same figures to scale.
Figure 1

Claim against measurement, the 1990s episode

Share of United States electricity. Amber bars are what was forecast. Blue and green bars are what was corrected and measured.

0%10%20% 30%40%50% FORECAST, 1999 Internet share claimed for 1998 to 1999 8% Forecast within one to two decades 30% to 50% CORRECTED AND MEASURED Internet itself, corrected estimate well under 1% All office, telecom and network equipment roughly 3% United States data centers, measured 2010 1.7% to 2.2% The gap between the second amber bar and the blue bars is the whole of the 1990s error.
Forecast values: Huber and Mills, Forbes, May 31, 1999 (Note 1) and Mills, Greening Earth Society, May 1999 (Note 2). Corrected values: Koomey, LBNL-46509, August 2000 (Note 3). Measured 2010 United States data center share: Koomey, Analytics Press, August 1, 2011 (Note 7). Bars are drawn to the stated percentages. The "well under 1 percent" bar is drawn at a nominal width because the source states a bound rather than a point value, and is labeled as such.
What actually happened

Reality came in an order of magnitude lower

The definitive retrospective found that global data center electricity use was about 1.1 to 1.5 percent of world electricity in 2010, and about 1.7 to 2.2 percent for the United States, with United States growth of only about 36 percent from 2005 to 2010 against a previously projected doubling.7 The gap between forecast and reality was closed by efficiency, better chips, better data center design, virtualization, and the effects of the 2008 financial crisis. A later recalibration confirmed that compute demand rose far faster than energy use over the following decade.8

Diagram B

Why the miss happened

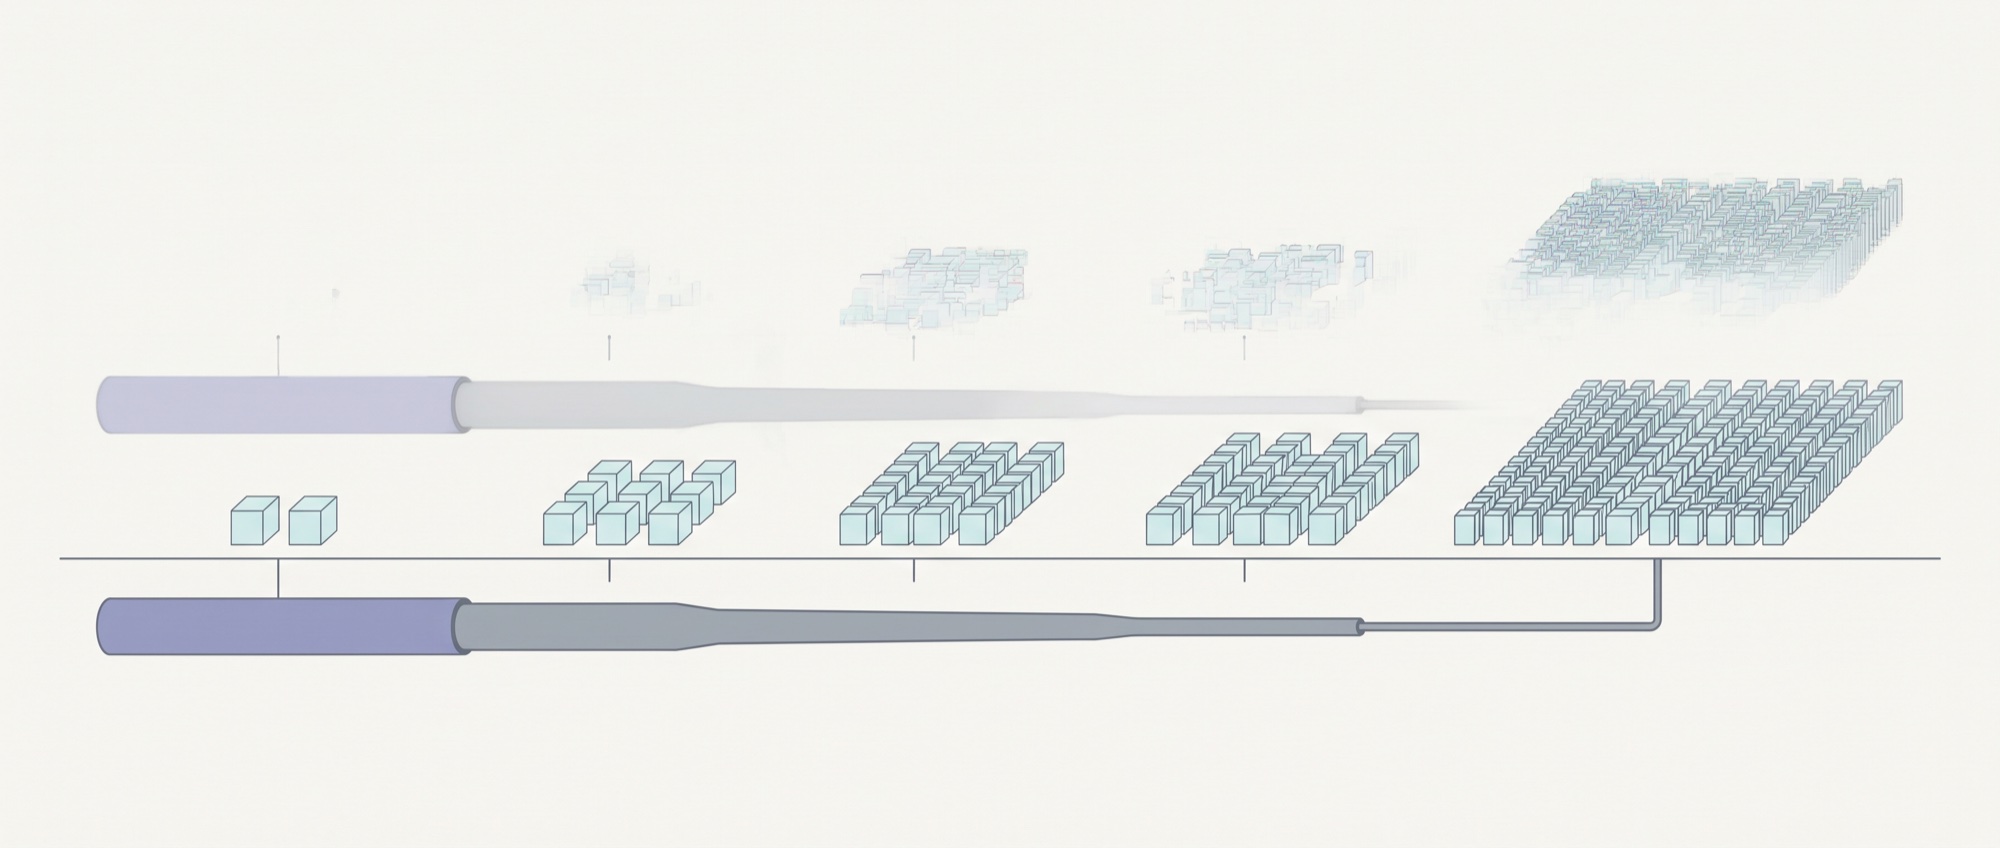
The number of machines rose enormously while the supply feeding each one kept shrinking

A single row of five groups of identical small cubes stands on a ground line, growing from two cubes at the left to a dense packed block of well over a hundred at the right. Below the ground line one supply pipe runs the full width, very thick at the left and tapering to a fine hairline beneath the largest group.
Schematic, no quantities asserted. It depicts the mechanism the sources name rather than any measured series: compute demand rose far faster than energy use over the following decade (Note 8), and United States data center electricity use grew only about 36 percent from 2005 to 2010 against a previously projected doubling (Note 7). Figure 2 below gives those two figures to scale.
Figure 2

Why the forecast broke: growth projected against growth that occurred

United States data center electricity use, 2005 to 2010

+100%+75%+50% +25%0% +100% Previously projected a doubling +36% What occurred 2005 to 2010 efficiency, better chips, virtualization, 2008 crisis
Source: Koomey, "Growth in Data Center Electricity Use 2005 to 2010," Analytics Press, Oakland, California, August 1, 2011 (Note 7). The causes annotated on the arrow are those given in the underlying position paper for the same period. Recalibration confirming that compute demand rose far faster than energy use: Masanet et al., Science, February 28, 2020 (Note 8).
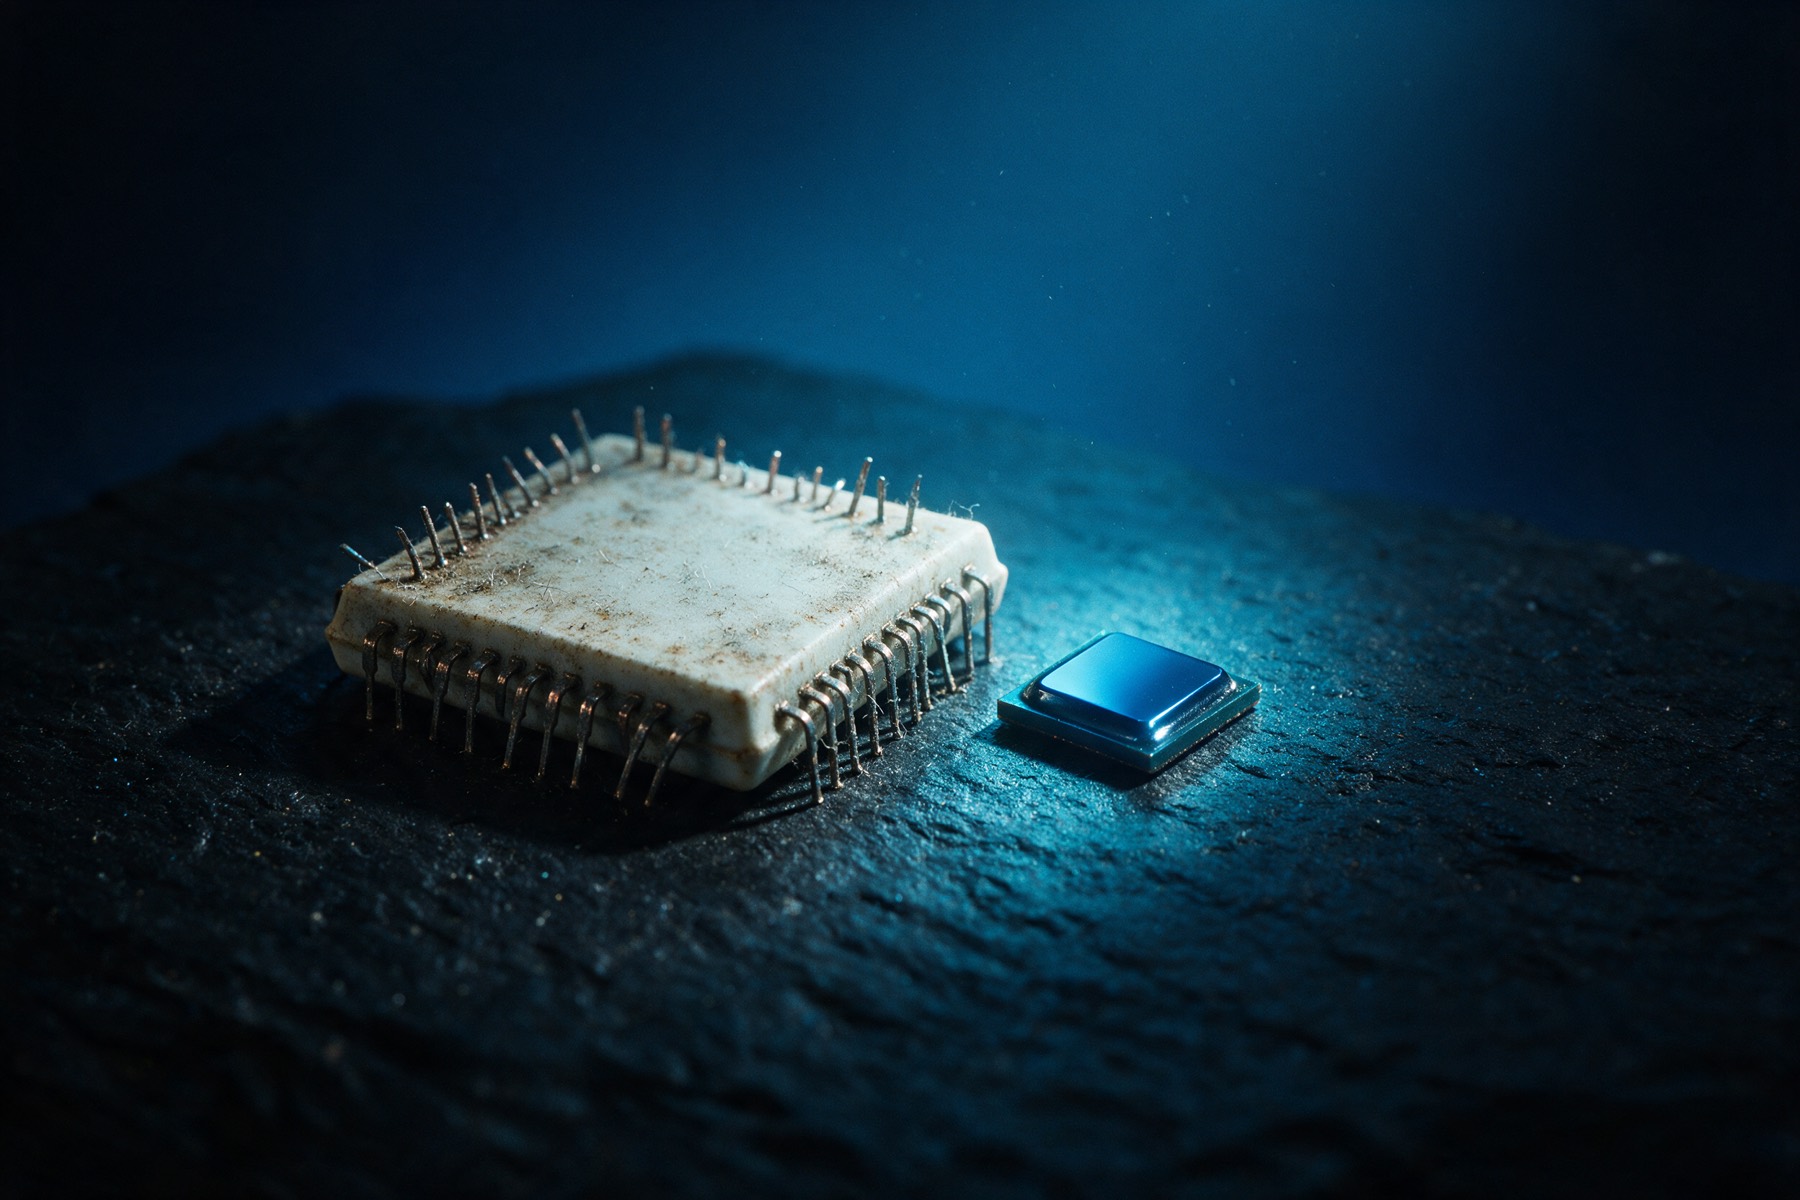
A large dusty 1990s ceramic processor beside a tiny modern chip package on a dark slate surface.
The mechanism

Efficiency is what closed the gap

Not restraint, and not a collapse in demand for computing. Better chips, better data center design and virtualization did the work. Compute demand rose far faster than energy use over the following decade.

Koomey, Analytics Press, August 1, 2011 (Note 7); Masanet et al., Science, February 28, 2020 (Note 8).

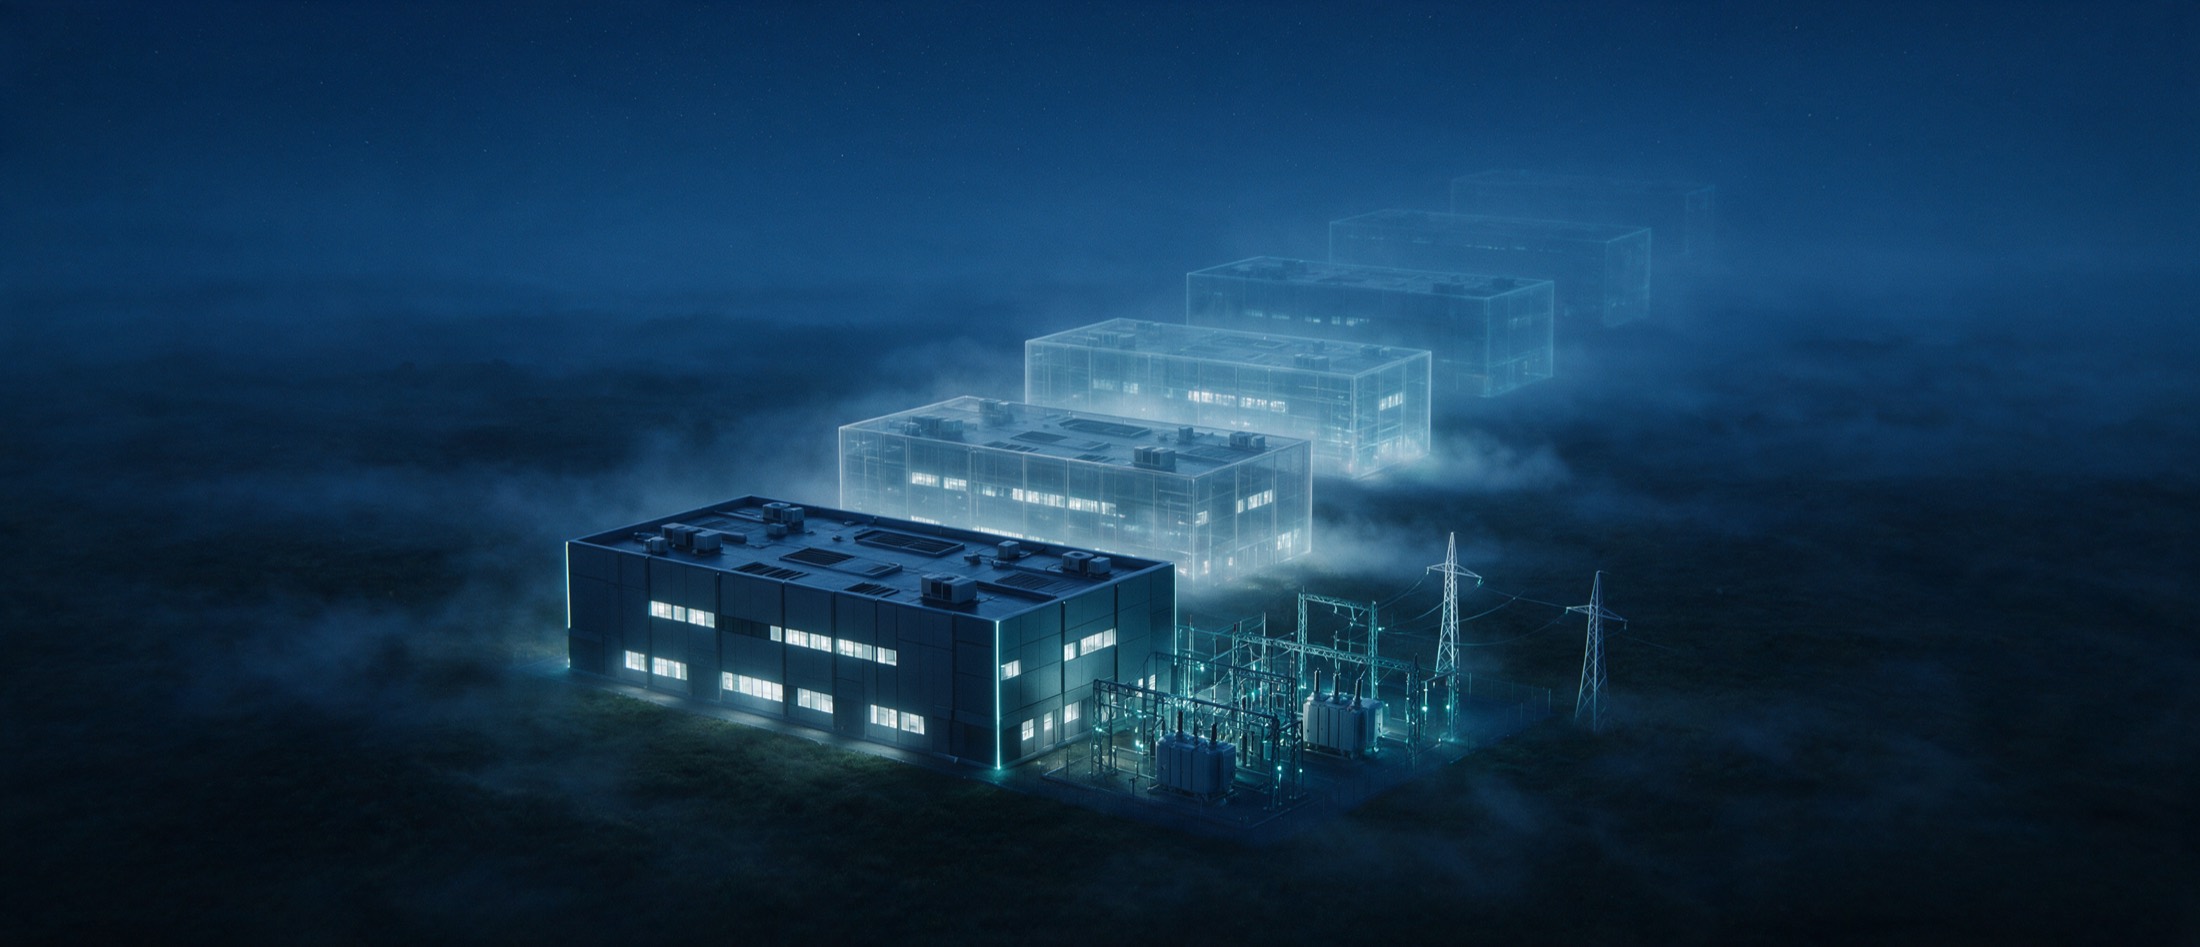
One solid, fully built data centre and substation in the foreground, followed by five progressively larger and more translucent ghost copies of the same building receding into mist.
Part Two

The 2020s artificial intelligence and data center forecast

This time the numbers come from national laboratories, the International Energy Agency and grid operators, and they start from something that was actually measured.

The measured baseline

A real starting point, not an assertion

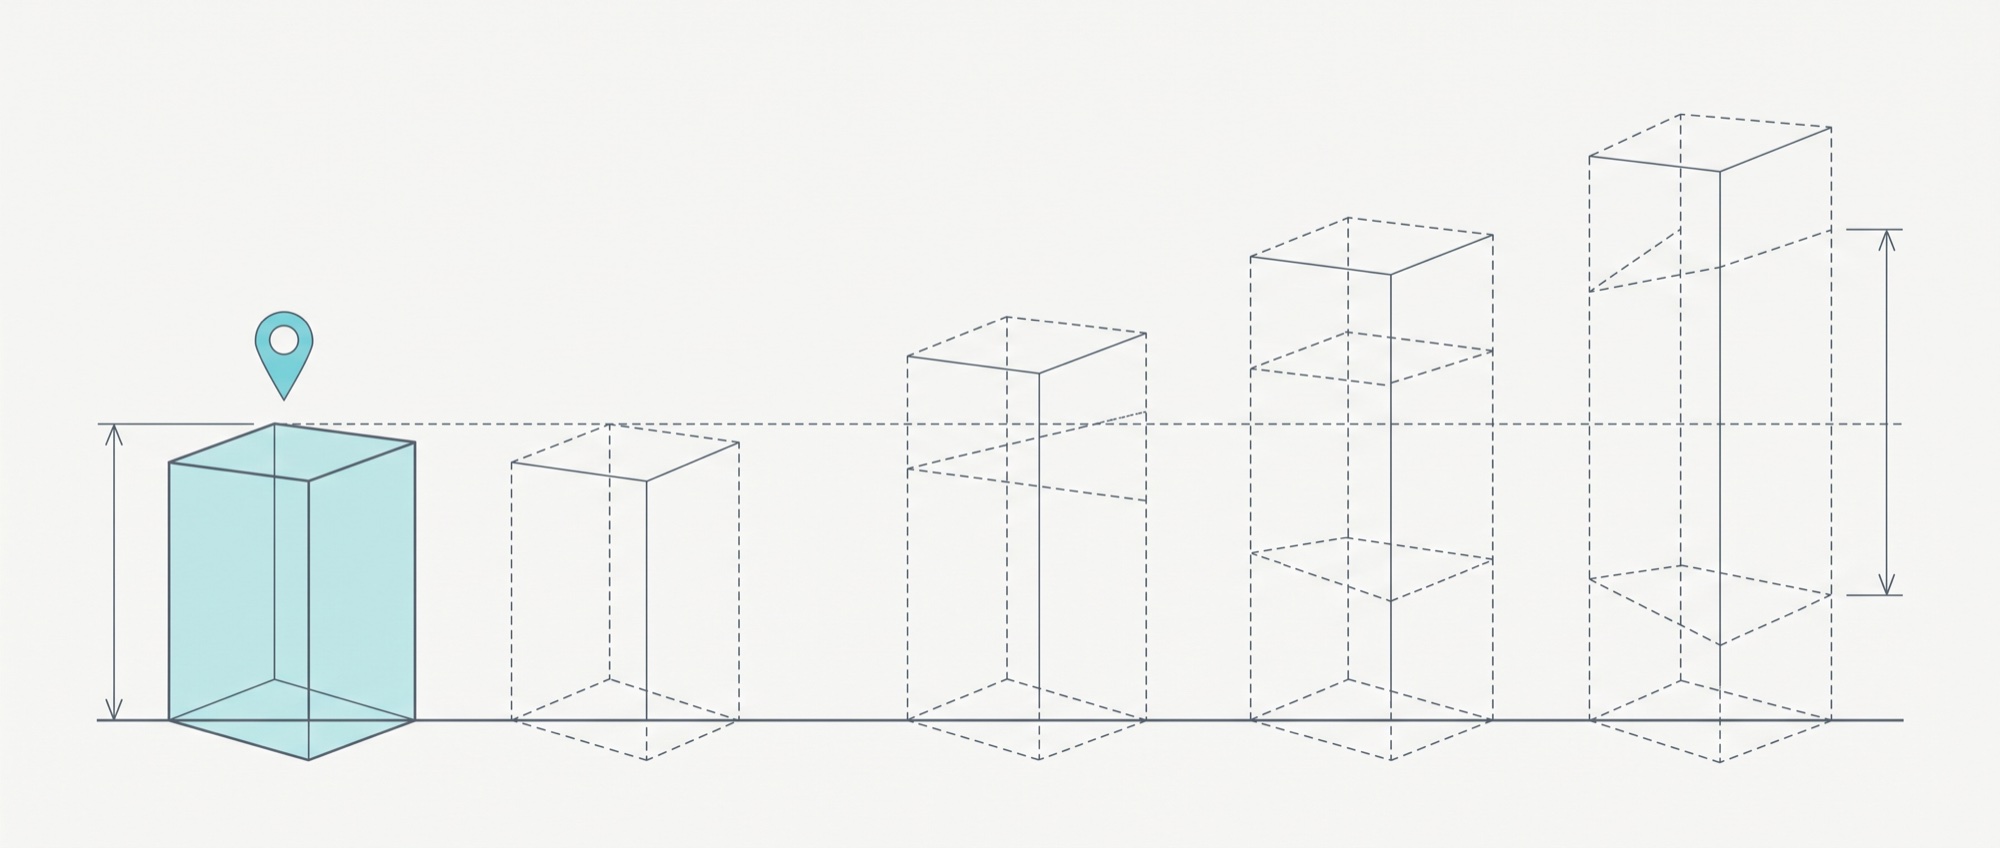
Unlike the 1990s episode, the current baseline is grounded in a national-laboratory bottom-up study. United States data centers used on the order of 176 to 183 terawatt-hours in 2023 to 2024, roughly 4.4 percent of United States electricity, with a projected range of about 6.7 to 12 percent by 2028.9

Diagram C

One measured present, many possible futures

A known quantity today, and a spread that widens with distance

One solid tinted volume stands on a baseline at the left with a dimension arrow beside it. To its right, four progressively taller volumes are drawn in broken outline, each showing an upper and a lower bound, with a bracket at the far right spanning the full spread.
Schematic, drawn to no scale. Solid volume: the measured 2023 to 2024 baseline of 176 to 183 terawatt-hours, roughly 4.4 percent of United States electricity. Broken outlines: the projected range of about 6.7 to 12 percent by 2028 (Note 9). The widening of the range with distance is the point of the drawing. Figure 3 below plots the same values to scale.
Figure 3

United States data centers as a share of national electricity

Measured points and projected ranges. Ranges are drawn as bands because the sources publish ranges, not point values.

0%2%4% 6%8%10%12% 1.7% to 2.2% 2010 measured Note 7 4.4% 2023 to 2024 measured, 176 to 183 TWh Note 9 6.7% to 12% 2028 projected range Note 9 above 9% 2030 scenario, share of generation Note 12
2010 measured share: Koomey, Analytics Press, August 1, 2011 (Note 7). 2023 to 2024 measured share and 2028 projected range: Shehabi et al., Lawrence Berkeley National Laboratory LBNL-2001637, December 2024 (Note 9). 2030 scenario: Electric Power Research Institute, "Powering Intelligence," 2024, which places United States data center load above 9 percent of national generation by 2030 (Note 12). Note that the 2030 bar is expressed against national generation while the earlier bars are expressed against national electricity, following the wording of each source. TWh means terawatt-hour.
The projections

Ranges, not a single alarming figure

The International Energy Agency projects that global data center electricity consumption roughly doubles to around 945 terawatt-hours by 2030 in its base case, just under 3 percent of global electricity, with artificial intelligence as the most important driver.10 The Energy Information Administration's 2026 outlooks record data centers driving the fastest commercial-sector demand growth in decades.11 Electric Power Research Institute scenarios place United States data center load above 9 percent of national generation by 2030.12

~945 TWh
Global data center electricity consumption in the base case for 2030, roughly a doubling, just under 3 percent of global electricity
International Energy Agency, "Energy and AI," April 2025 (Note 10)
Fastest in decades
Commercial-sector demand growth driven by data centers, as recorded in the 2026 outlooks
Energy Information Administration, 2026 (Note 11)
Above 9%
United States data center load as a share of national generation by 2030, in scenario analysis
Electric Power Research Institute, 2024 (Note 12)
The same analyst who debunked the 1990s forecasts is cautioning about these ones. Jonathan Koomey, with Zachary Schmidt, has published a guide to the current forecasts warning that time lags, proprietary data, and the practice of summing interconnection requests inflate near-term load estimates. Source: Koomey and Schmidt, "Electricity Demand Growth and Data Centers: A Guide for the Perplexed," Bipartisan Policy Center, 2025 (Note 13).
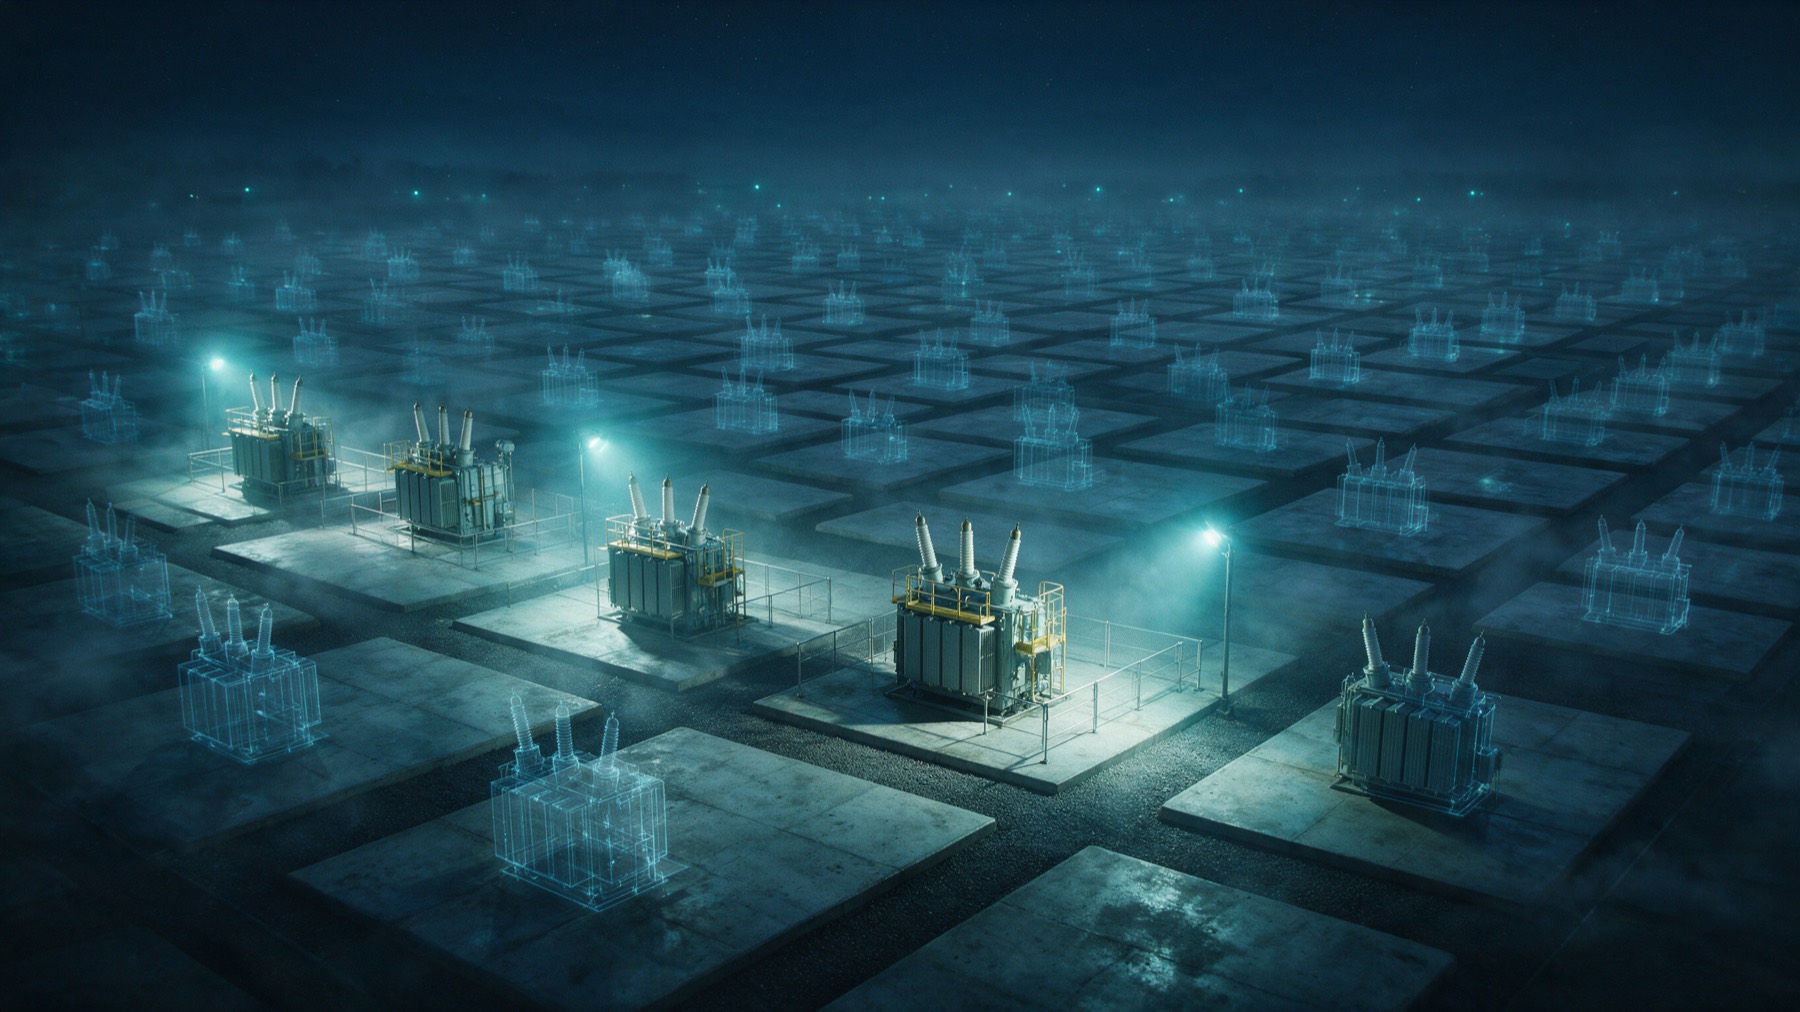
A substation yard where only a few concrete pads carry real transformers while dozens of others hold faint translucent ghost outlines of transformers that were requested but never built.
The caution

A request in the queue is not a built project

One of the three named inflation mechanisms is the practice of summing interconnection requests, counting every application for grid connection as though each one becomes real load. The other two are time lags and proprietary data that cannot be checked.

Koomey and Schmidt, Bipartisan Policy Center, 2025 (Note 13).

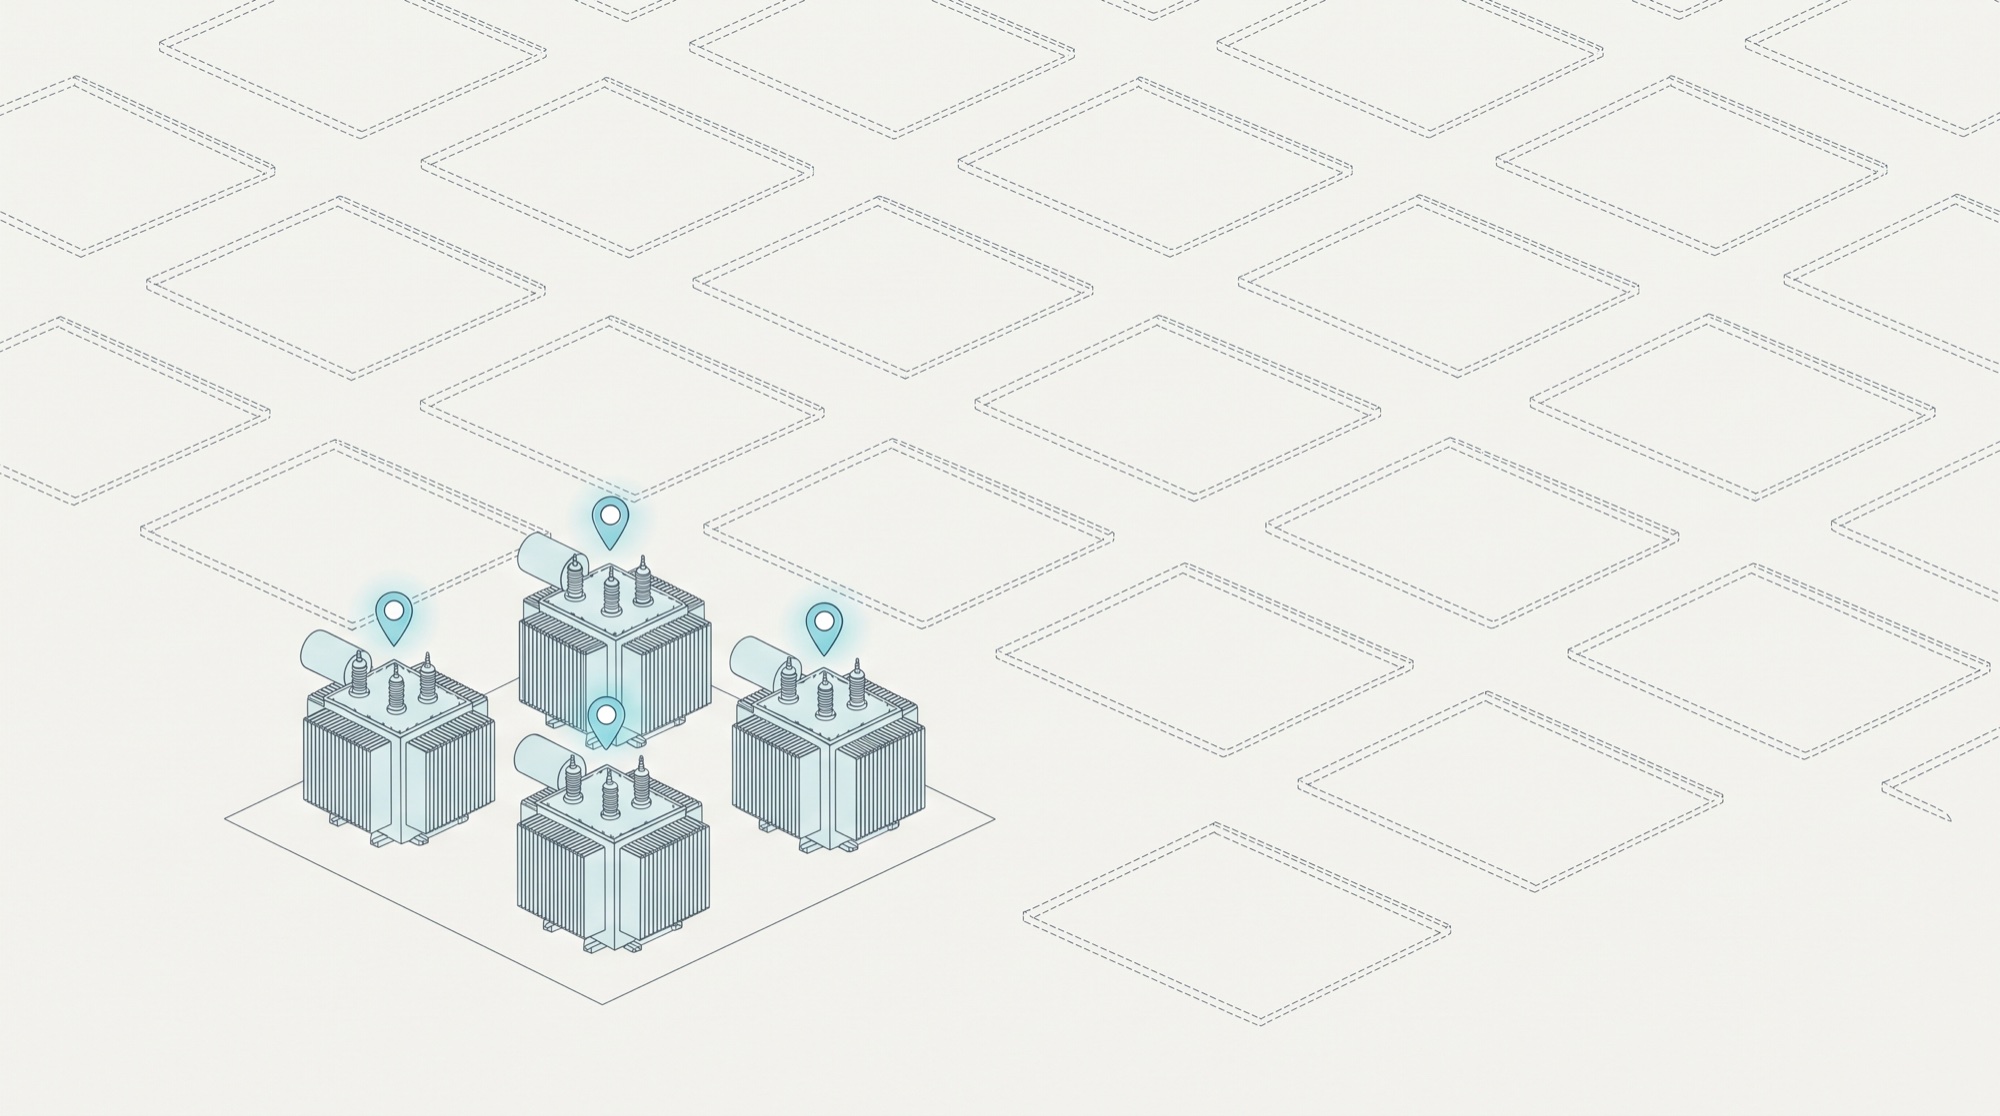
Diagram D

A request is not a project

Why summing interconnection requests overstates near-term load

An aerial view of a grid of concrete pads. A handful carry fully drawn transformers. The great majority carry only faint broken outlines of transformers that were requested but never built.
Schematic, no quantities asserted. It depicts one of the three cautions raised in Koomey and Schmidt, that the practice of summing interconnection requests inflates near-term load estimates because each request is counted as though it becomes a built project (Note 13). The ratio of built to requested shown here is illustrative and is not a measured ratio.
Figure 4

Three ways near-term load estimates get inflated

The cautions raised in the Bipartisan Policy Center guide

Time lags Announced load arrives later, or not at all, than the headline implies Proprietary data Key inputs are not public, so the estimates cannot be checked Summed interconnection Requests are counted as if each one becomes a built project Inflated near-term load estimate the caution, not a measured quantity
Source: Koomey and Schmidt, "Electricity Demand Growth and Data Centers: A Guide for the Perplexed," Bipartisan Policy Center, 2025 (Note 13). This figure is a diagram of the three cautions named in that source. It carries no quantities.
A colossal forge firing a single one-time blast of amber light, with a narrow conveyor of thousands of tiny cyan sparks running unbroken from its base to the far horizon.
Part Three

The inference thesis

Training is a periodic capital event. Inference is the continuous operating cost. The capital is being committed as though the first one is what matters.

Capital

Committed on training-era assumptions

The hyperscalers, Amazon, Microsoft, Google, Meta and Oracle, are guiding toward combined 2026 capital expenditure in the range of roughly $600 billion to $725 billion, an increase on the order of 60 to 77 percent year over year.14 Roughly three-quarters of that, about $450 billion, is tied directly to artificial intelligence infrastructure.15 Notably, this spend increasingly exceeds internal free cash flow and is being bridged with debt, a structural vulnerability if returns disappoint.16

Figure 5

Hyperscaler capital expenditure guidance for 2026

Amazon, Microsoft, Google, Meta and Oracle, combined

$0$200B$400B $600B$800B rest of capex upper end of the guidance range $600B to $725B combined 2026 capital expenditure about $450B tied to AI infrastructure roughly 75 percent of the total. Note 15. Up 60% to 77% year over year Note 14 Funding gap: the spend increasingly exceeds internal free cash flow and is bridged with debt. Aggregate fiscal year 2026 capital expenditure above $690 billion, funded increasingly by debt. Note 16.
Total range and year-over-year increase: Yahoo Finance, 2026, reporting roughly $725 billion combined 2026 capital expenditure, up about 77 percent year over year (Note 14). Artificial intelligence share: Introl, "Hyperscaler CapEx Hits $600B in 2026," January 2026, estimating roughly 75 percent, about $450 billion (Note 15). Debt bridging: FactSet, 2025, noting aggregate fiscal year 2026 capital expenditure above $690 billion funded increasingly by debt (Note 16). The underlying position paper states the guidance as a range of roughly $600 billion to $725 billion, and Notes 14 and 15 report the upper and lower figures respectively. It is drawn as a range for that reason.
Where the money actually goes

The economics live in inference, not training

Training is a periodic capital event; inference is the continuous operating cost. Industry analysis places inference at 80 to 90 percent of the lifetime compute cost of a production artificial intelligence system.17 The inference market is projected to exceed $250 billion by 2030, overtaking training as the dominant enterprise artificial intelligence expense.18

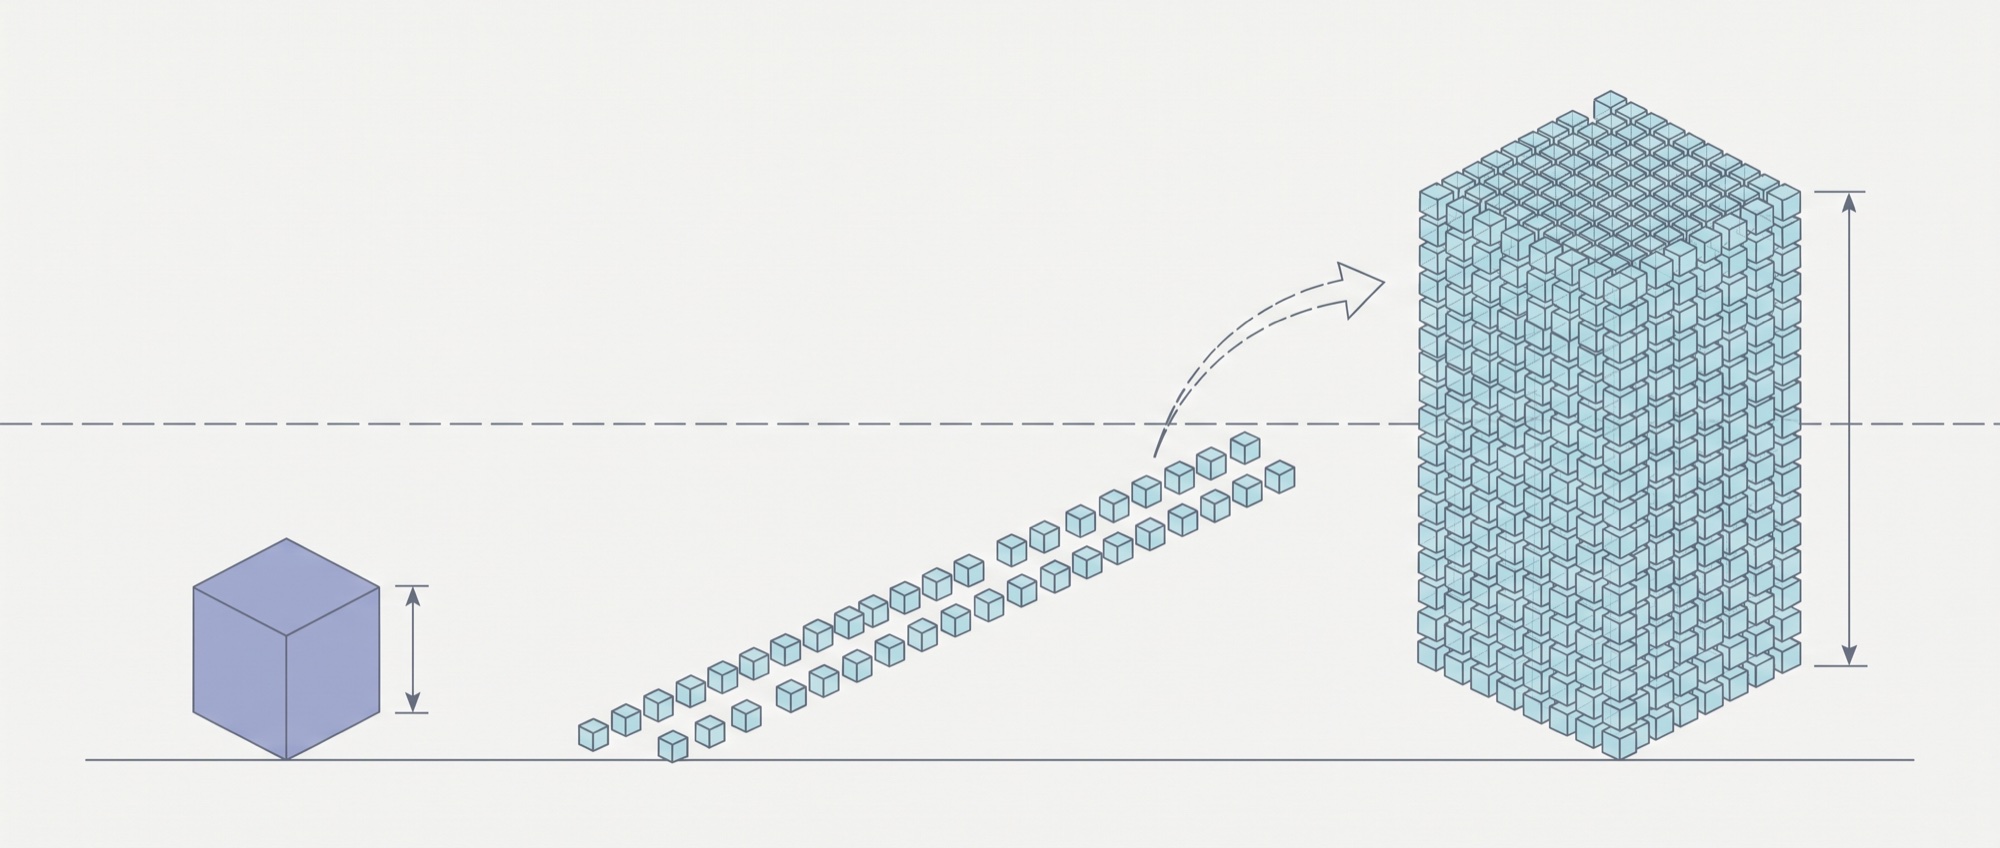
Diagram E

The one-time cost, and the one that never stops

Training happens once; inference repeats for the life of the system

A single medium-sized cube stands on a ground line at the left. Across the middle runs a long single-file row of many dozens of tiny cubes. At the right those same tiny cubes appear gathered and stacked into one tower roughly four times the height of the single cube.
Schematic. Training is a periodic capital event; inference is the continuous operating cost, and industry analysis places inference at 80 to 90 percent of the lifetime compute cost of a production artificial intelligence system (Note 17). The four-to-one height ratio drawn here is a visual device, not a measured ratio. Figure 6 below gives the sourced 80 to 90 percent split.
Figure 6

Where the lifetime compute cost actually sits

Production artificial intelligence system, lifetime compute cost

80% to 90% is inference Inference, the continuous operating cost 80 to 90 percent of lifetime compute cost. Note 17. Training, a periodic capital event The remainder, 10 to 20 percent. Note 17. Inference market above $250 billion by 2030 Overtaking training as the dominant enterprise expense. Note 18.
Inference share of lifetime compute cost: Introl, "AI Inference vs Training Infrastructure Economics," 2025 (Note 17). The donut is drawn at the midpoint of the stated 80 to 90 percent range; the range itself is what the source gives, and is labeled. Market size: Adebayo, Forbes, October 29, 2025, citing a MarketsandMarkets projection of a $250 billion plus inference market by 2030 (Note 18).
Two identical glowing cyan spheres: the left fed by a colossal fracturing wall of server racks through thick blazing conduits, the right fed by a single small chip on a bench through one hair-thin cable.
The competitive shock

An efficiency claim moved the market

Not a capacity claim. Not a demand claim. A claim that the same class of output could be produced for far less, and the largest single-day loss of market value in United States history followed.

Competition

A race to the bottom on inference cost

Inference cost for output of the quality of GPT-3 has fallen by roughly three orders of magnitude in about two years.19 The competitive shock is concrete: the release of DeepSeek R1 in January 2025 erased roughly $600 billion of Nvidia market capitalization in a single session, about a 17 percent decline.20 Chinese developers have continued to cut prices aggressively and to demonstrate efficient training and inference methods, compressing margins industry-wide.21

Figure 7

The cost of inference, on a logarithmic scale

Cost of producing output of the quality of GPT-3, indexed to 1 at the start

1x0.1x0.01x0.001x relative cost, log scale start about two years later Roughly 1,200-fold decline about three orders of magnitude, in about two years
Source: SemiAnalysis, "DeepSeek Debates: Chinese Leadership On Cost, True Training Cost, Closed Model Margin Impacts," 2025, noting that inference cost for output of the quality of GPT-3 fell roughly 1,200-fold (Note 19). Shape is illustrative. The source gives the endpoints and the magnitude of the decline, not a dated cost series, so only the two endpoints and the 1,200-fold ratio are sourced. The curve between them is drawn for legibility and should not be read as a monthly path. GPT-3 refers to the third-generation Generative Pre-trained Transformer model.
Diagram F

The kind of claim that moved the market

The same output, produced from a very much smaller input

Two identical tinted cubes of equal size sit side by side, marked as equal by a short broken bracket between them. The left cube is fed by a large solid mass through a thick pipe. The right cube is fed by a single small block through a hairline thread.
Schematic, no quantities asserted. It depicts the nature of the claim, that the same class of output could be produced for far less, which is what distinguishes an efficiency claim from a capacity or demand claim (Notes 19, 20, 21). The market consequence is shown to scale in the figure below, which plots actual published closing prices.
Figure 8

What the market did when an efficiency claim landed

Nvidia Corporation, daily closing price, December 20, 2024 to February 28, 2025

$120$130$140$150 Dec 20Jan 6Jan 21Jan 27Feb 10Feb 28 DeepSeek R1 released, Jan 20 $142.62 Jan 27: $118.42, down 17.0% largest one-day market value loss on record
Price series: Nvidia Corporation (NVDA) daily closing prices, Yahoo Finance chart API, query1.finance.yahoo.com/v8/finance/chart/NVDA, accessed August 3, 2026. Every plotted point is an actual published close; nothing here is modeled or smoothed. The 17.0 percent figure is computed directly from the two closes shown, $142.62 on January 24, 2025 and $118.42 on January 27, 2025. Market value lost: roughly $589 billion to $600 billion, the largest single-day loss in United States market history, per CNBC, January 27, 2025 and Bloomberg, January 27, 2025; the underlying position paper cites the same event at roughly 17 percent and about $600 billion (Note 20). January 20, 2025 was a United States market holiday, so the first full session after the DeepSeek R1 release was January 21. The chart marks the release date, and does not assert that every subsequent move had a single cause.
-17.0%
Nvidia single-session decline, January 27, 2025, from a close of $142.62 to $118.42
Closes from Yahoo Finance chart API, accessed August 3, 2026; event per Note 20
~1,200x
Decline in inference cost for output of the quality of GPT-3, in about two years
SemiAnalysis, "DeepSeek Debates," 2025 (Note 19)
$7.8B
Custom edge-inference application-specific integrated circuit revenue projected for 2025
Edge AI and Vision Alliance, November 2025 (Note 22)
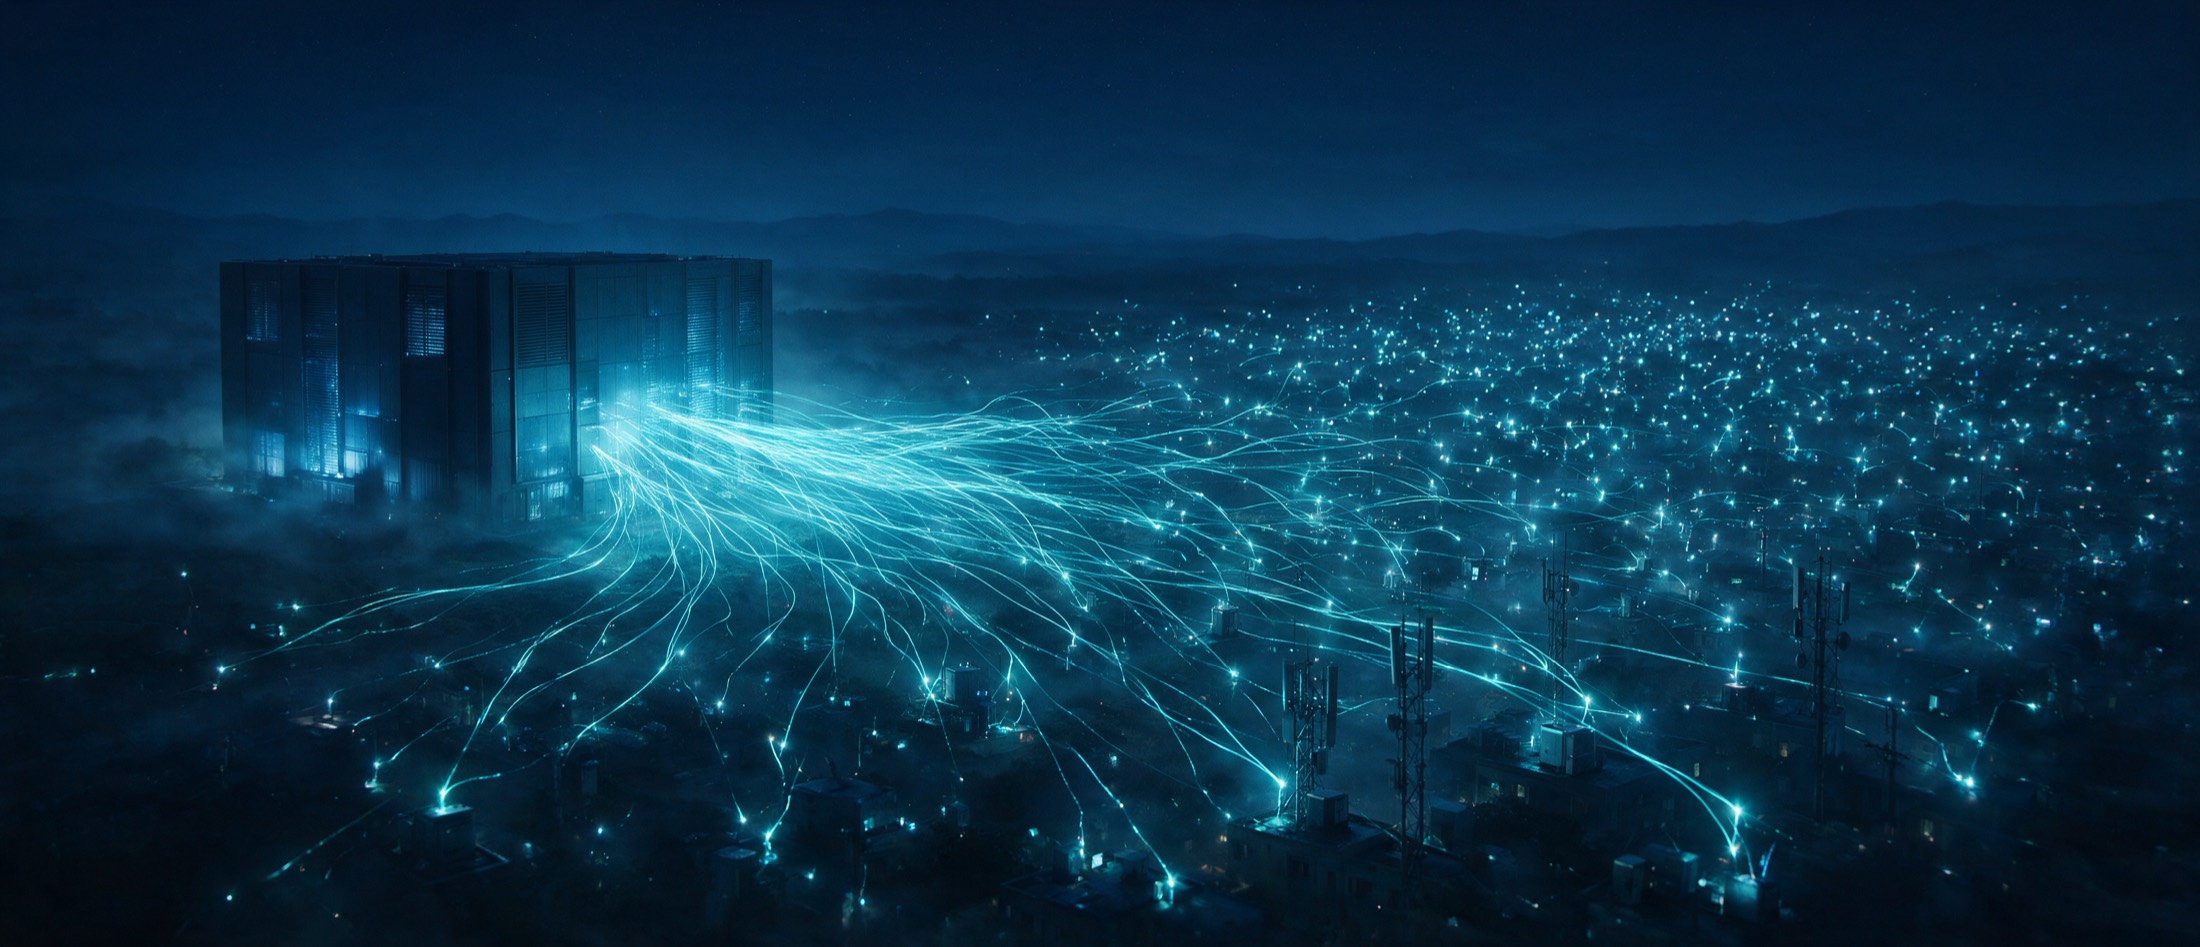
A dimming hyperscale data center on the left streams cyan filaments outward that branch into hundreds of small bright edge nodes across a dark landscape.
The migration

The light leaves the big box

Edge and on-device inference lowers latency, cost, bandwidth and power. Analysts increasingly expect a meaningful share of inference to move off the hyperscale cloud toward smaller edge sites and devices, which changes where, and how much, power is drawn.

Edge AI and Vision Alliance, November 2025 (Note 22); Latitude Media, 2025 (Note 23); Deloitte, Technology, Media and Telecom Predictions 2026 (Note 24).

One hall, then many nodes

Inference does not disappear when it leaves the hyperscale hall. It divides. Purpose-built edge inference chips use less energy per inference than the training-class accelerators they displace, so the same work is done at lower power in more places.

Deloitte, Technology, Media and Telecom Predictions 2026 (Note 24); Edge AI and Vision Alliance, November 2025 (Note 22). Diagram is schematic and carries no quantities.

The periphery

What moves, and what it changes

Edge and on-device inference lowers latency, cost, bandwidth and power, and the silicon market is responding, with custom edge-inference application-specific integrated circuit revenue approaching $7.8 billion in 2025.22 Analysts increasingly expect a meaningful share of inference to move off the hyperscale cloud toward smaller edge sites and devices.23 Purpose-built edge inference chips use less energy per inference than the training-class accelerators they displace.24

Figure 9

What moves, and what it changes

Migration of inference from hyperscale data centers toward edge sites and devices

Hyperscale cloud training-class accelerators higher energy per inference inference Note 23 Edge sites and devices purpose-built inference silicon less energy per inference, Note 24 Lower latency Lower cost Lower bandwidth Lower power Four effects named in Note 22
Effects of edge and on-device inference on latency, cost, bandwidth and power, and the $7.8 billion 2025 custom edge-inference silicon figure: Edge AI and Vision Alliance, "AI at the Edge: Low Power, High Stakes," November 2025 (Note 22). Expectation of migration off the hyperscale cloud: Latitude Media, "Will inference move to the edge?" 2025 (Note 23). Lower energy per inference for purpose-built edge chips versus training-class accelerators: Deloitte, Technology, Media and Telecom Predictions 2026 (Note 24). This figure is a diagram of those stated relationships and carries no quantities of its own.
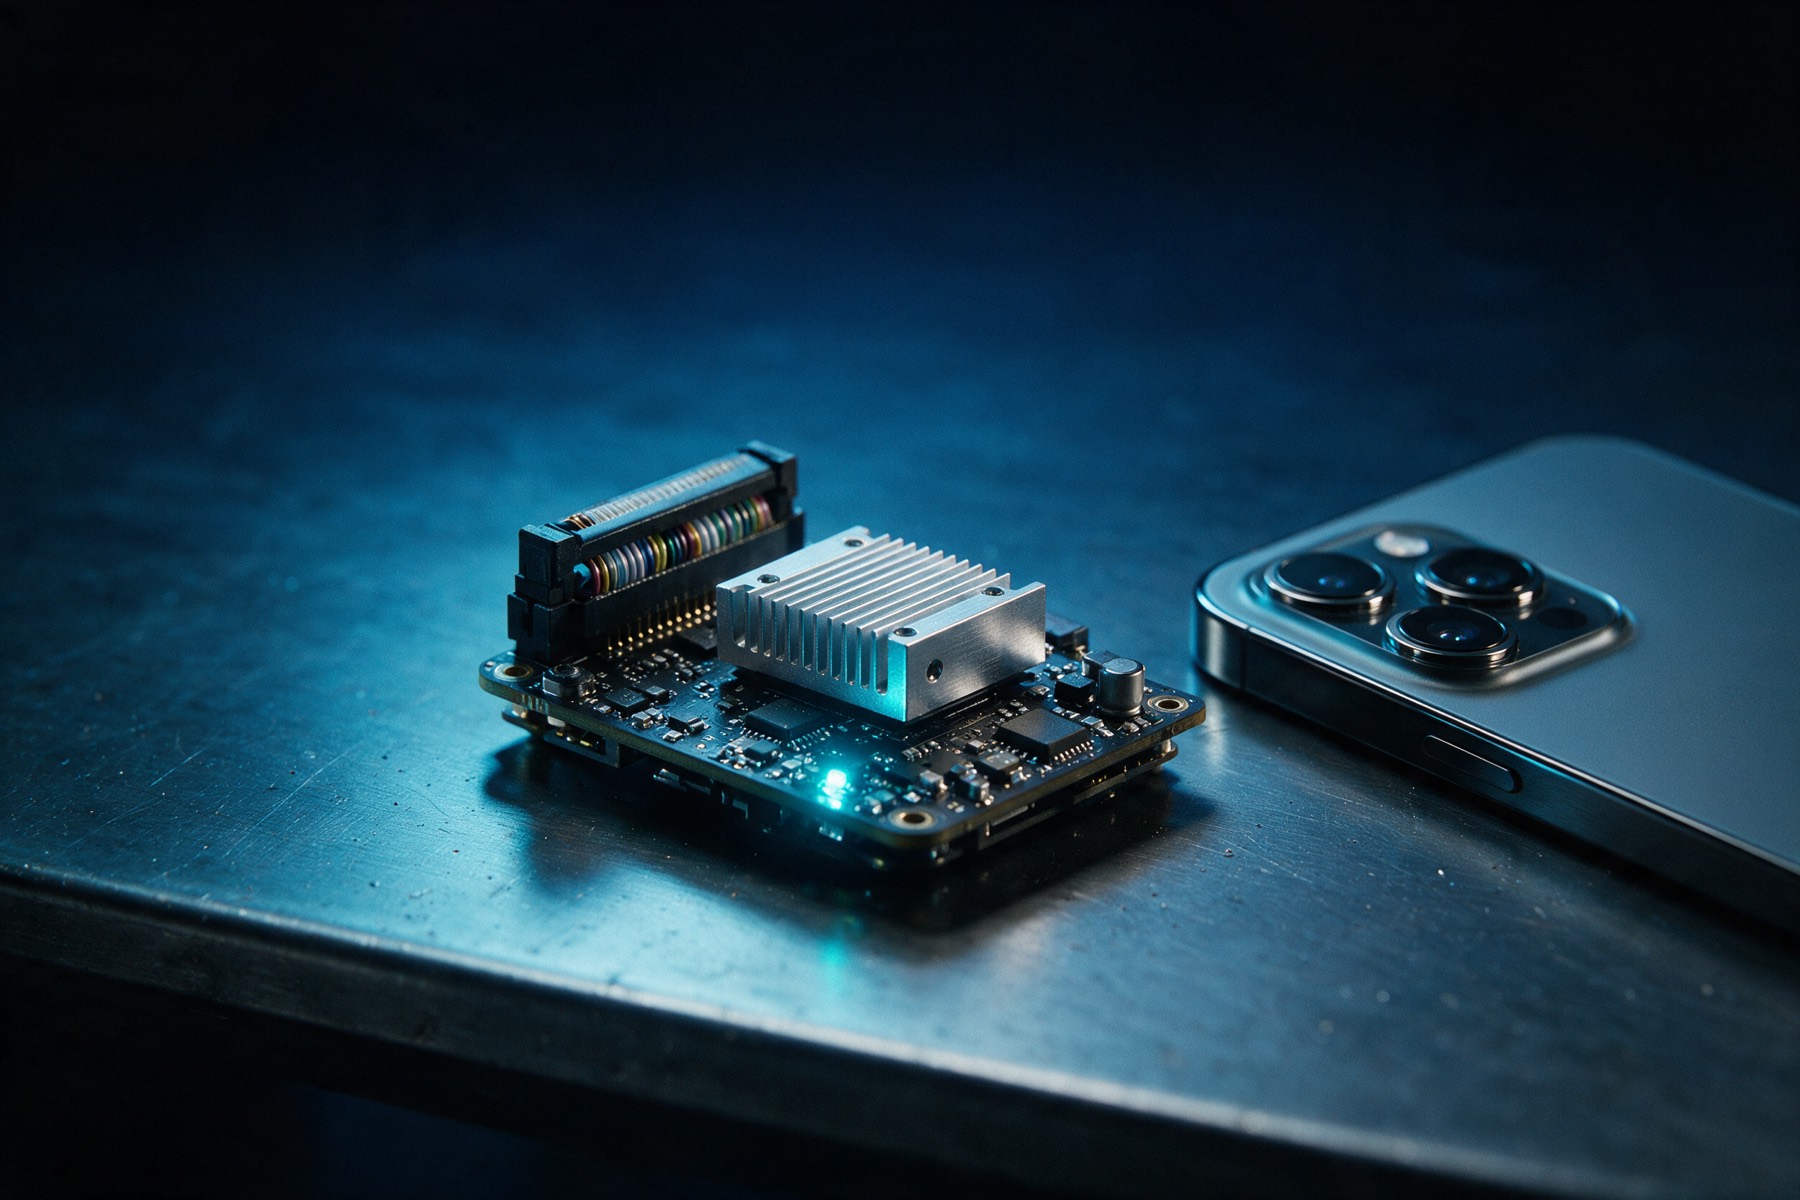
A small edge computing module with a heatsink on a dark workbench beside a smartphone.
The hardware

The work moves to where the power is smaller

Custom edge-inference chip revenue is projected near $7.8 billion for 2025. The silicon is following the workload.

Edge AI and Vision Alliance, "AI at the Edge: Low Power, High Stakes," November 2025 (Note 22).

A frame split in two: on the left a descending staircase of ever smaller processors in cyan against a night skyline; on the right a single glowing module multiplied into an endless amber field.
Part Four

Two forces, pulling in opposite directions

On the left, downward pressure. Inference dominates lifetime cost. Price competition led by Chinese developers keeps cutting what an inference costs. The work migrates to lower-power edge silicon. Every arrow points at lower power per useful task.

On the right, upward pressure. The Jevons paradox: when a thing gets cheap enough, we use vastly more of it. One cheap module becomes an endless field of them, and aggregate demand rises even as each unit falls.

Notes 17, 19, 20, 21, 22, 23, 24 on the downward side; Notes 24 and 25 on the upward side.

The countervailing force

The efficiency argument is not one-directional

The Jevons paradox holds that cheaper unit costs can expand total consumption, and several analysts argue that falling per-inference cost will induce enough new demand to raise aggregate power use despite efficiency gains.25 Deloitte similarly cautions that the next artificial intelligence phase may demand more compute in aggregate, not less, even as each inference gets cheaper.24 This is the genuine open question that distinguishes the current episode from the 1990s one, and it is why the honest answer is a probability distribution rather than a single number.13

Diagram G

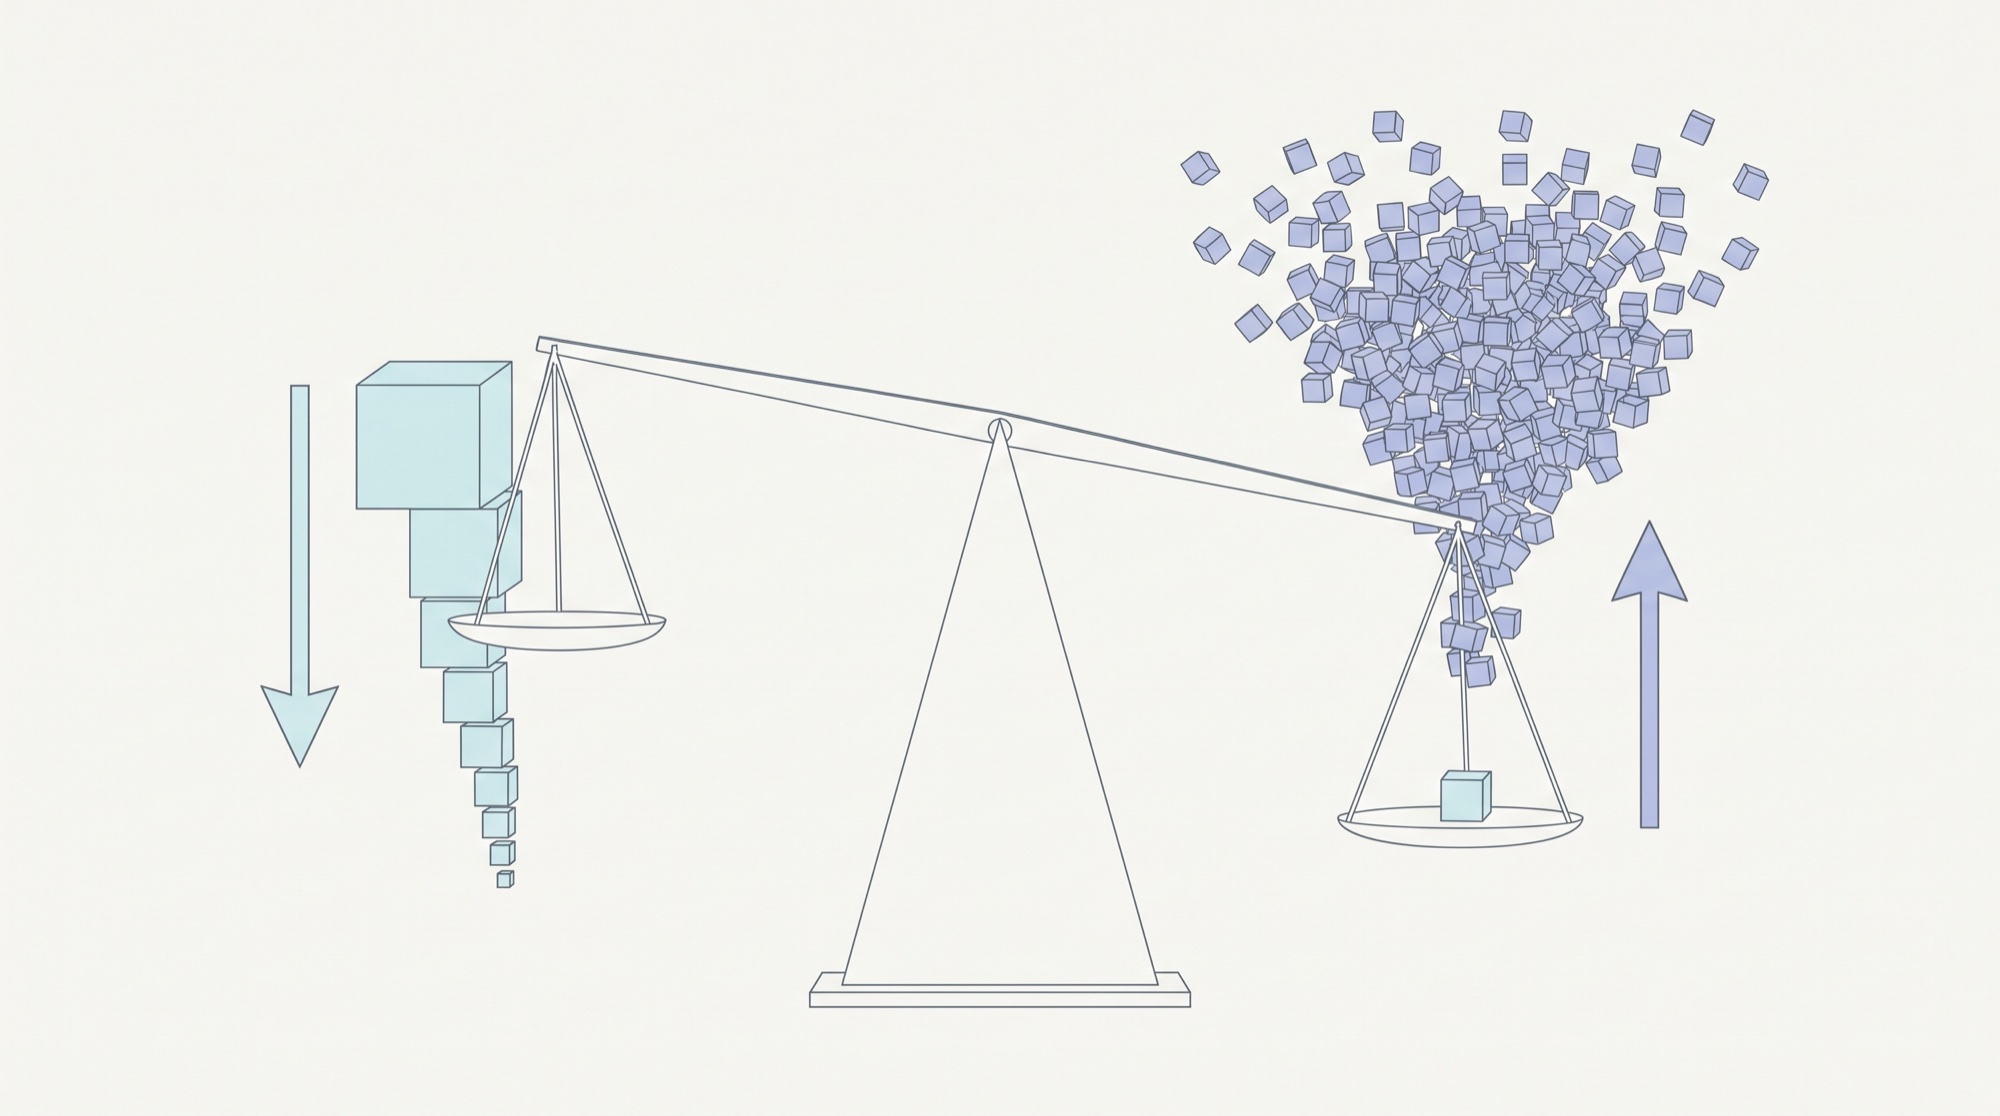
Two forces, close to evenly matched

Falling unit cost on one side, expanding total use on the other

A beam balance rests near level on a central fulcrum. The left pan carries a stack of blocks that shrink to almost nothing, with a large downward arrow beside it. The right pan carries one small block multiplied into a dense swarm of hundreds, with a large upward arrow beside it.
Schematic, no quantities asserted. Downward pressure: inference dominates lifetime cost, price competition led by Chinese developers, and migration to lower-power edge silicon (Notes 17, 19, 21, 22, 23, 24). Upward pressure: the Jevons paradox, under which cheaper unit costs expand total consumption (Note 25), and the caution that the next phase may demand more compute in aggregate, not less (Note 24). The near-level beam represents the unresolved state of the question (Note 13) and is not a computed balance.
Figure 10

Two forces pulling in opposite directions

The efficiency case against the rebound case

Downward pressure Inference dominates lifetime cost. Note 17. Price competition led by Chinese developers. Notes 19, 20, 21. Migration to lower-power edge silicon. Notes 22, 23, 24. Lower power per useful task Upward pressure Jevons paradox: cheaper unit costs can expand total consumption. Note 25. The next phase may demand more compute in aggregate, not less. Note 24. Higher aggregate demand Genuinely unresolved, which is why the answer is a distribution Note 13
Sources as labeled in each box. This figure summarizes the argument of Part Four of the underlying position paper and asserts no quantity. Jevons paradox and rebound effects: National Center for Energy Analytics, "The Rise of AI: A Reality Check on Energy and Economic Impacts," 2025 (Note 25).
Three roads diverging: the left peters out into scrub, the right climbs steeply into darkness, and only the centre road is lit by a continuous cyan ribbon with transmission towers alongside.
Conclusion

Between the extremes

Real and substantial data center load growth, with the highest-end projections overshooting for the same structural reason the 1990s forecasts did.

Synthesis

What is genuinely different this time, and what is not

The 1990s forecast was made by advocates with a commercial interest in the conclusion, published in the popular and financial press, and it failed by more than an order of magnitude because efficiency outran demand. The current forecast is made by national laboratories, the International Energy Agency and grid operators, rests on a measured baseline, and is expressed as scenario ranges rather than a single alarming figure. That is a real improvement in rigor.

Comparison of the 1999 episode and the 2026 episode across five dimensions
DimensionThe 1999 episodeThe 2026 episode
Who produced it Advocates with a commercial interest in the conclusion. The supporting report was published by a group funded by coal interests. Notes 1, 2. A national laboratory, the International Energy Agency, the Energy Information Administration and the Electric Power Research Institute. Notes 9, 10, 11, 12.
Where it was published The popular and financial press. Note 1. Bottom-up technical studies and outlooks. Note 9.
Starting point An estimate later shown to be overstated by more than an order of magnitude. Note 3. A measured baseline of 176 to 183 terawatt-hours, roughly 4.4 percent of United States electricity. Note 9.
How it is expressed A single alarming figure: 30 to 50 percent of national supply. Note 1. Scenario ranges, for example 6.7 to 12 percent by 2028. Note 9.
The efficiency risk Realized. Efficiency outran demand and the forecast broke. Notes 7, 8. Live and already visible in inference cost, edge migration and price competition. Notes 17, 19, 22.

The inference thesis in this document sharpens the skeptical case. Because inference dominates lifetime cost, because inference is subject to intense price competition led by Chinese developers, and because inference is migrating to lower-power edge deployment, the economic pressure runs toward efficiency and lower power per useful task. The strongest counterargument is the Jevons paradox, under which cheaper inference expands total usage enough to lift aggregate demand. The likeliest outcome is therefore between the extremes, real and substantial data center load growth, but with the highest-end projections overshooting for the same structural reason the 1990s forecasts did.

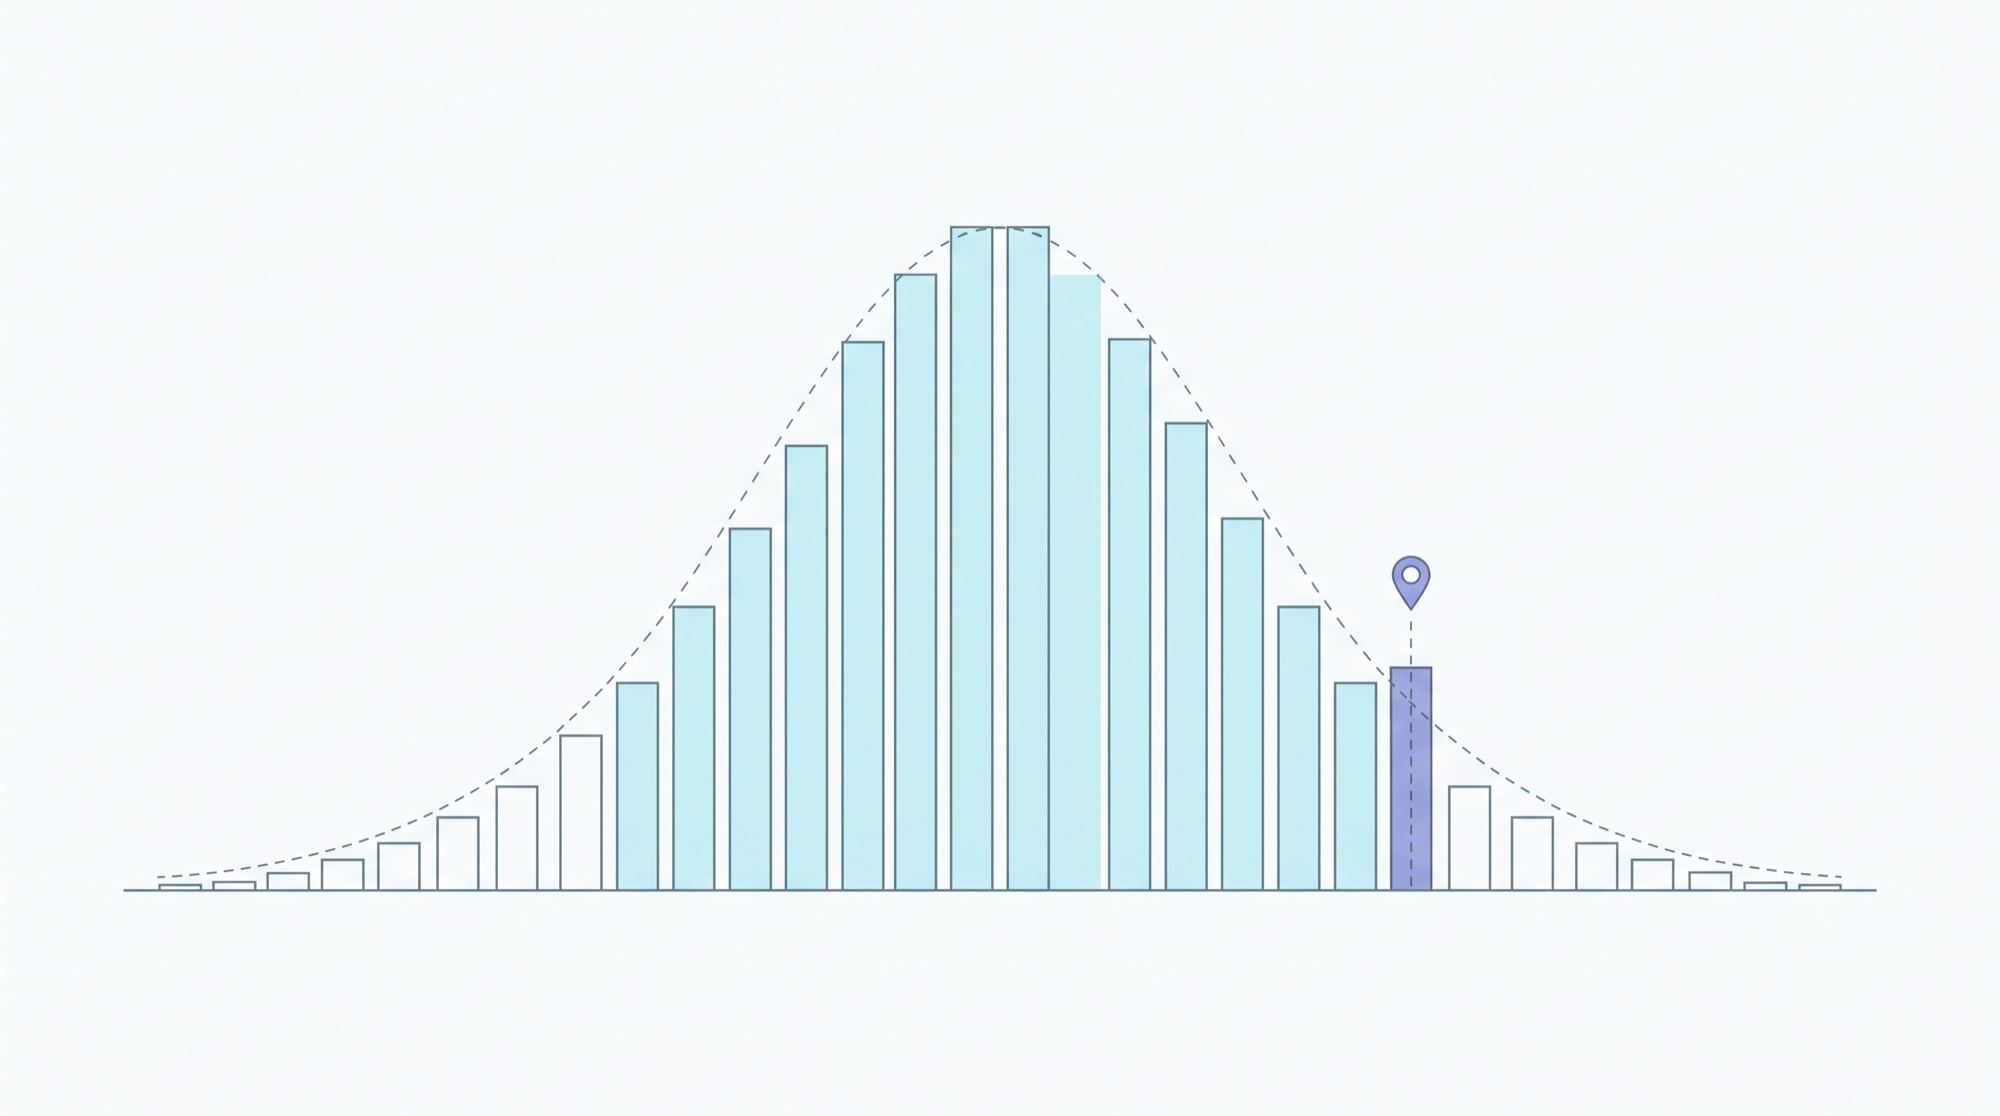
Diagram H

A distribution, and a single number inside it

Why a confident point forecast is one narrow slice of a much wider spread

A long row of bars stands on a shared baseline forming a clear bell shape, the tall central bars tinted and a broken curve traced across their tops. One bar far out in the thin right tail is picked out in a different tint and marked with a pin above it.
Schematic, no probabilities asserted. It restates the framing of Koomey and Schmidt, that the honest answer to this question is a probability distribution rather than a single number (Note 13). The highlighted bar out in the tail stands for a confident high-end point forecast. Neither the shape of the bell nor the position of the highlighted bar is derived from any published probability estimate.
Figure 11

Where the answer most likely sits

A distribution, not a point forecast

likeliest outcome Efficiency dominates modest load growth Real and substantial growth below the highest-end projections High end realized requires Jevons to dominate
Illustrative, not a modeled distribution. The curve conveys the qualitative conclusion of the underlying position paper, that the likeliest outcome sits between the extremes, and it is not derived from any published probability estimate. The framing that the answer should be a distribution rather than a single number follows Koomey and Schmidt, Bipartisan Policy Center, 2025 (Note 13). The competing pressures are those cited in Parts Three and Four.
Reference

Terms and acronyms

Every abbreviation used above, spelled out.

AIArtificial intelligence.
ASICApplication-specific integrated circuit. A chip designed for one job rather than for general-purpose computing.
CapexCapital expenditure. Spending on long-lived assets such as buildings, servers and electrical equipment.
EIAUnited States Energy Information Administration.
EPRIElectric Power Research Institute.
FCFFree cash flow. Cash generated by operations after capital spending, that is, cash available to fund growth or service debt.
GPT-3The third-generation Generative Pre-trained Transformer language model, used here as a fixed quality benchmark for comparing inference cost over time.
IEAInternational Energy Agency.
InferenceRunning a trained model to produce an answer. The continuous operating cost of an artificial intelligence system.
Jevons paradoxThe observation that improving the efficiency with which a resource is used can increase, rather than reduce, total consumption of that resource.
LBNLLawrence Berkeley National Laboratory.
Order of magnitudeA factor of ten. "More than an order of magnitude" therefore means more than tenfold.
TrainingBuilding a model from data. A periodic capital event rather than a continuous operating cost.
TWhTerawatt-hour. One billion kilowatt-hours.
Edge inferenceInference performed on local sites or on the device itself rather than in a hyperscale data center.
HyperscalerAn operator of very large cloud data center fleets. Here: Amazon, Microsoft, Google, Meta and Oracle.
A dark desk in an archive at night, a stack of bound technical reports and an open book with blank pages under a cool lamp.
Sources

Everything, cited

Twenty-five references, reproduced from the underlying position paper without alteration.

Provenance of this page. All text, figures and citations are drawn from the position paper "Two Electricity-Demand Panics, Twenty-Five Years Apart," prepared for Jason Masters, Gaiergy Corp, New York City, dated August 2, 2026, held at Considerations on AI Power Needs and Bubble.docx. The note list below reproduces that paper's reference list. Figures 4, 9 and 10 are diagrams of relationships stated in the sources and assert no quantities of their own. Figures 7 and 11 are labeled where the drawn shape is illustrative rather than sourced. Figure 8 is plotted from an external price series and is sourced separately in its own caption. No statement here has been added beyond what the underlying paper and its cited sources state.
About the imagery. The photographic images in this document are generated illustrations, produced with Seedream 5.0 Pro through kie.ai on August 3, 2026 and commissioned for this page. They are interpretive artwork: they are not photographs of any actual facility, company, product, market or event, they depict no identifiable real place, and they carry no data. Every quantity appears only in the text, in the vector figures and in the notes below. Original files are archived at ~/Documents/Kie Generations/.
  1. Peter Huber and Mark P. Mills, "Dig more coal, the PCs are coming," Forbes, May 31, 1999, pp. 70 to 72.
  2. Mark P. Mills, "The Internet Begins with Coal: A Preliminary Exploration of the Impact of the Internet on Electricity Consumption," Arlington, Virginia: The Greening Earth Society, May 1999.
  3. Jonathan G. Koomey, "Rebuttal to Testimony on Kyoto and the Internet: The Energy Implications of the Digital Economy," Lawrence Berkeley National Laboratory, LBNL-46509, August 2000.
  4. Kaoru Kawamoto, Jonathan Koomey, Bruce Nordman, Richard E. Brown, Mary Ann Piette, Michael Ting and Alan Meier, "Electricity used by office equipment and network equipment in the U.S.," Energy, The International Journal, vol. 27, no. 3, March 2002, pp. 255 to 269.
  5. Amory B. Lovins and Mark Mills, documented email exchanges on Internet electricity use, Rocky Mountain Institute, 1999.
  6. Jonathan Koomey et al., "Sorry, Wrong Number: The Use and Misuse of Numerical Facts in Analysis and Media Reporting of Energy Issues," Annual Review of Energy and the Environment, 2002.
  7. Jonathan G. Koomey, "Growth in Data Center Electricity Use 2005 to 2010," Analytics Press, Oakland, California, August 1, 2011.
  8. Eric Masanet, Arman Shehabi, N. Lei, Sarah Smith and Jonathan Koomey, "Recalibrating global data center energy-use estimates," Science, vol. 367, February 28, 2020, pp. 984 to 986.
  9. Arman Shehabi, Sarah J. Smith, Alex Hubbard, Alex Newkirk, N. Lei, M.A.B. Siddik, B. Holecek, Jonathan Koomey, Eric Masanet and Dale Sartor, "2024 United States Data Center Energy Usage Report," Lawrence Berkeley National Laboratory, LBNL-2001637, December 2024.
  10. International Energy Agency, "Energy and AI," World Energy Outlook Special Report, April 2025.
  11. U.S. Energy Information Administration, Annual Energy Outlook 2026 and Short-Term Energy Outlook, 2026.
  12. Electric Power Research Institute, "Powering Intelligence: Analyzing Artificial Intelligence and Data Center Energy Consumption," 2024.
  13. Jonathan Koomey and Zachary Schmidt, "Electricity Demand Growth and Data Centers: A Guide for the Perplexed," Bipartisan Policy Center, 2025.
  14. Yahoo Finance, "Meta, Microsoft, Amazon, and Alphabet are about to spend a shocking amount of money to dominate the AI era," 2026, reporting roughly $725 billion combined 2026 capital expenditure, up about 77 percent year over year.
  15. Introl, "Hyperscaler CapEx Hits $600B in 2026," January 2026, estimating roughly 75 percent, about $450 billion, tied to artificial intelligence infrastructure.
  16. FactSet, "Hyperscalers Tap External Financing as AI Capex Outruns Cash Flow," 2025, noting aggregate fiscal year 2026 capital expenditure above $690 billion funded increasingly by debt.
  17. Introl, "AI Inference vs Training Infrastructure Economics," 2025, reporting inference at 80 to 90 percent of the lifetime cost of a production artificial intelligence system.
  18. Kolawole Samuel Adebayo, "The Rise Of The AI Inference Economy," Forbes, October 29, 2025, citing a MarketsandMarkets projection of a $250 billion plus inference market by 2030.
  19. SemiAnalysis, "DeepSeek Debates: Chinese Leadership On Cost, True Training Cost, Closed Model Margin Impacts," 2025, noting GPT-3-quality inference cost fell roughly 1,200-fold.
  20. PRZC Research, "China AI and DeepSeek: The Efficiency Shock and Its Investment Fallout," 2025, documenting Nvidia's roughly 17 percent single-day decline, about $600 billion market capitalization, following the DeepSeek R1 release on January 20, 2025.
  21. FP Analytics, Foreign Policy, "Powering the AI Era," May 20, 2025, discussing DeepSeek efficiency and the Jevons paradox in artificial intelligence inference.
  22. Edge AI and Vision Alliance, "AI at the Edge: Low Power, High Stakes," November 2025, projecting custom edge-inference application-specific integrated circuit revenue near $7.8 billion in 2025.
  23. Latitude Media, "Will inference move to the edge?" 2025.
  24. Deloitte, "Why AI's next phase will likely demand more computational power, not less," Technology, Media and Telecom Predictions 2026.
  25. National Center for Energy Analytics, "The Rise of AI: A Reality Check on Energy and Economic Impacts," 2025, on the Jevons paradox and rebound effects.
  26. Nvidia Corporation daily closing prices used in Figure 8: Yahoo Finance chart API, query1.finance.yahoo.com/v8/finance/chart/NVDA, accessed August 3, 2026. Market value lost on January 27, 2025 cross-checked against CNBC and Bloomberg, both January 27, 2025. This source is additional to the underlying position paper's reference list.