
Fighting Words, Fact-Checked
An Independent Analysis of J.P. Morgan's 16th Annual Energy Paper
An Independent Analysis of J.P. Morgan's 16th Annual Energy Paper
Purpose
Michael Cembalest's annual energy paper is one of the most widely circulated pieces of energy commentary in the finance industry, and its claims routinely get repeated in investment memos, board decks, and client conversations without independent verification. Gaiergy Corp's goal in publishing this analysis is to independently fact-check the claims in the 16th edition, "Fighting Words" (J.P. Morgan Asset & Wealth Management, March 3, 2026), against primary sources, and to give readers a clear, source-backed verdict on which of its arguments hold up, which are debatable, and which are wrong — so that Gaiergy's clients and the broader energy community can cite this paper (or push back on it) with confidence rather than borrowed authority.
This is not a summary of Cembalest's paper. It is an independent, adversarial check: Gaiergy researchers traced roughly 85 discrete factual claims across all 16 topic sections back to primary sources (government agencies, peer-reviewed papers, court records, company filings, and the underlying datasets Cembalest himself cites) and scored each one Correct, Debatable, or Wrong.
Headline Finding
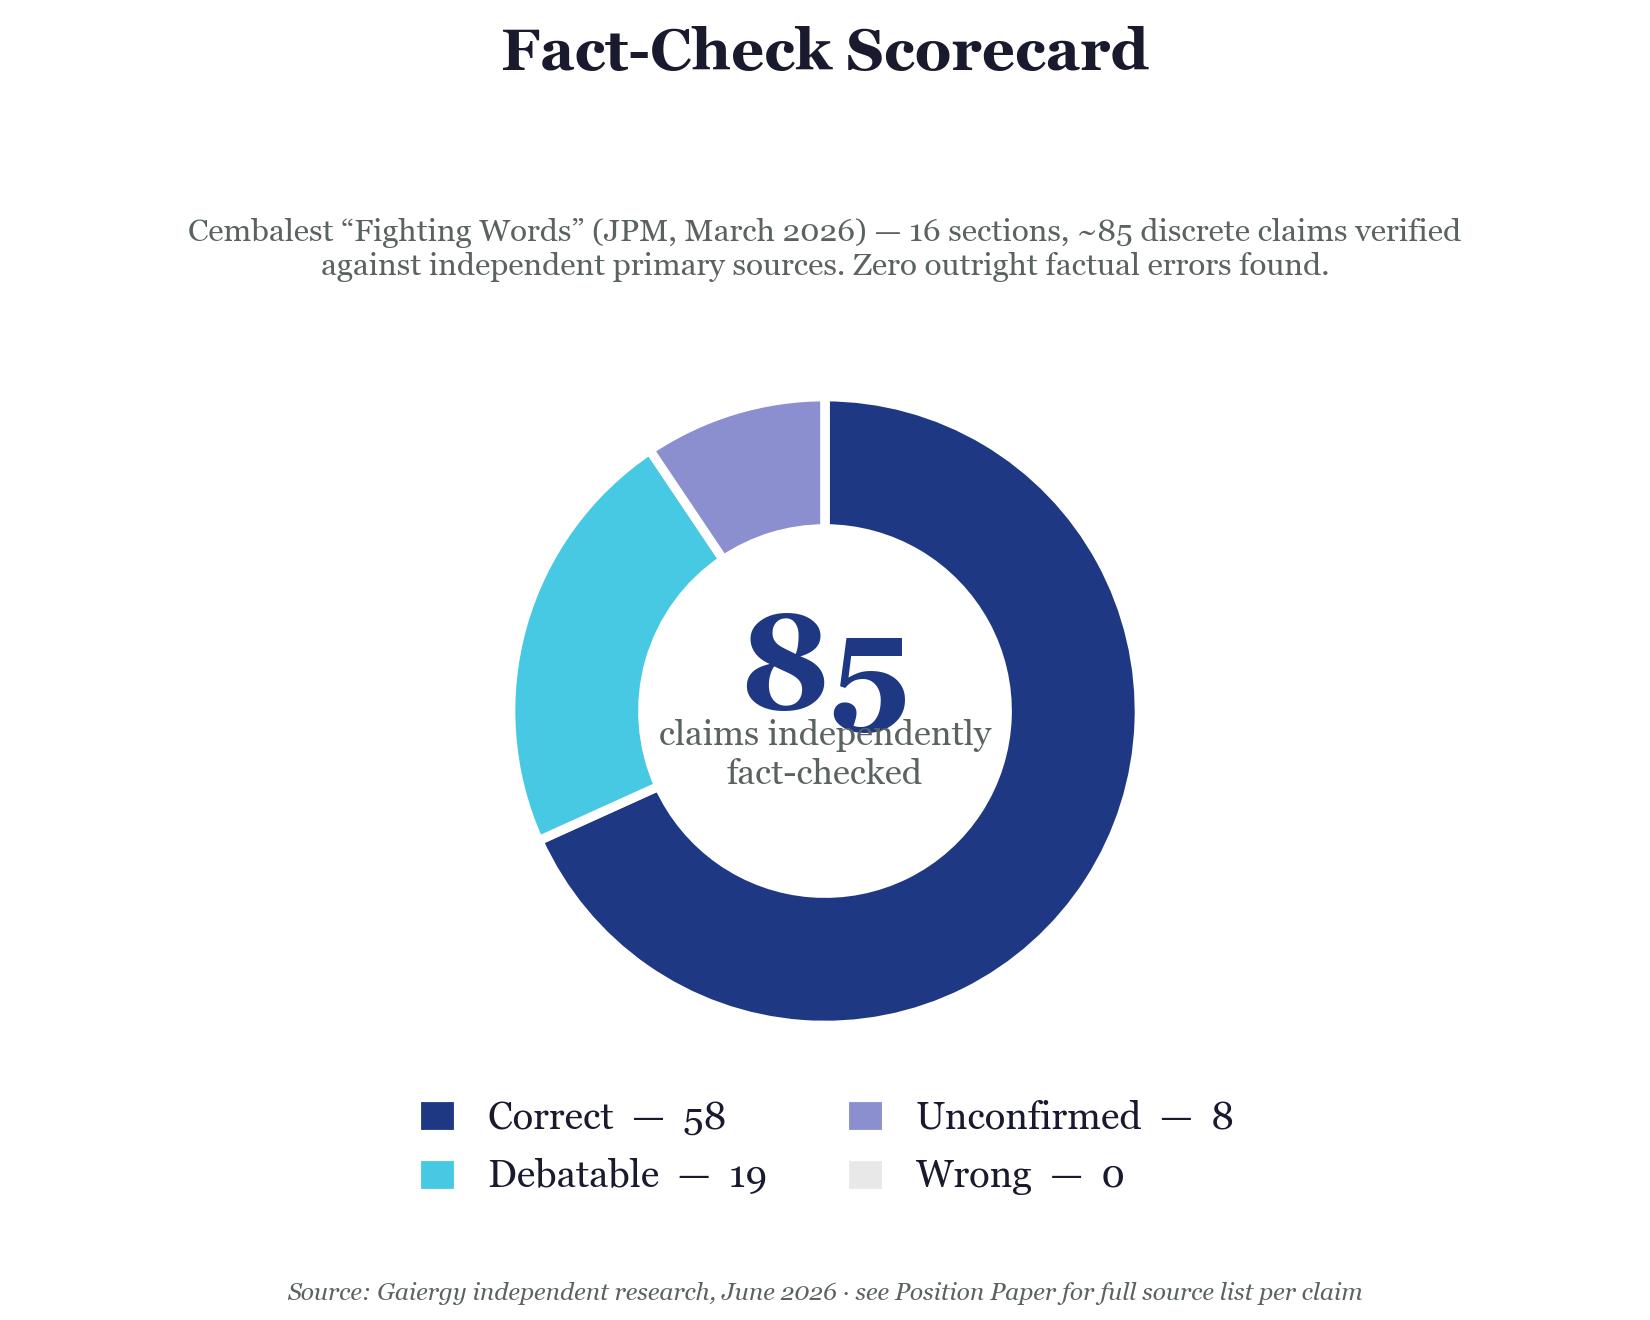
Across roughly 85 discrete claims spanning all 16 topic sections, Gaiergy found zero outright factual fabrications. Cembalest is unusually well-footnoted for a bank research note — nearly every figure traces to a real, findable primary or reputable secondary source. Where the paper is weakest is not in invented facts but in three recurring patterns: occasional imprecise or stale figures, editorializing and rhetorical framing layered on top of accurate data, and a handful of places where Cembalest's own cited source actually supports a stronger conclusion than the one he draws — meaning he is sometimes more conservative than his own footnotes justify, the opposite of cherry-picking.
How We Scored It
Every claim in this report is scored using one of four verdict badges, applied consistently throughout:
Correct Debatable Unconfirmed Wrong
| Verdict | Definition |
|---|---|
| Correct | The claim traces cleanly to a primary or reputable secondary source and is accurately characterized, including cases where minor rounding or dating is still within a fair tolerance. |
| Debatable | The underlying fact is real, but the framing, magnitude, causal attribution, or editorial characterization is contestable — not wrong, but not the only fair reading either. |
| Unconfirmed | Gaiergy could not independently verify or refute the claim against any public dataset or primary document. This is a verification gap, not a finding of error. |
| Wrong | The claim is factually inaccurate against primary sources. None were found in this paper. |
Each claim below carries an adjacent, visible citation — either an inline "(Source: …)" note or a linked reference — so readers can check Gaiergy's work exactly as Gaiergy checked Cembalest's.
Centerpiece Deep-Dive · pp. 29-33, Appendix I pp. 91-92, Smil essay pp. 87-90
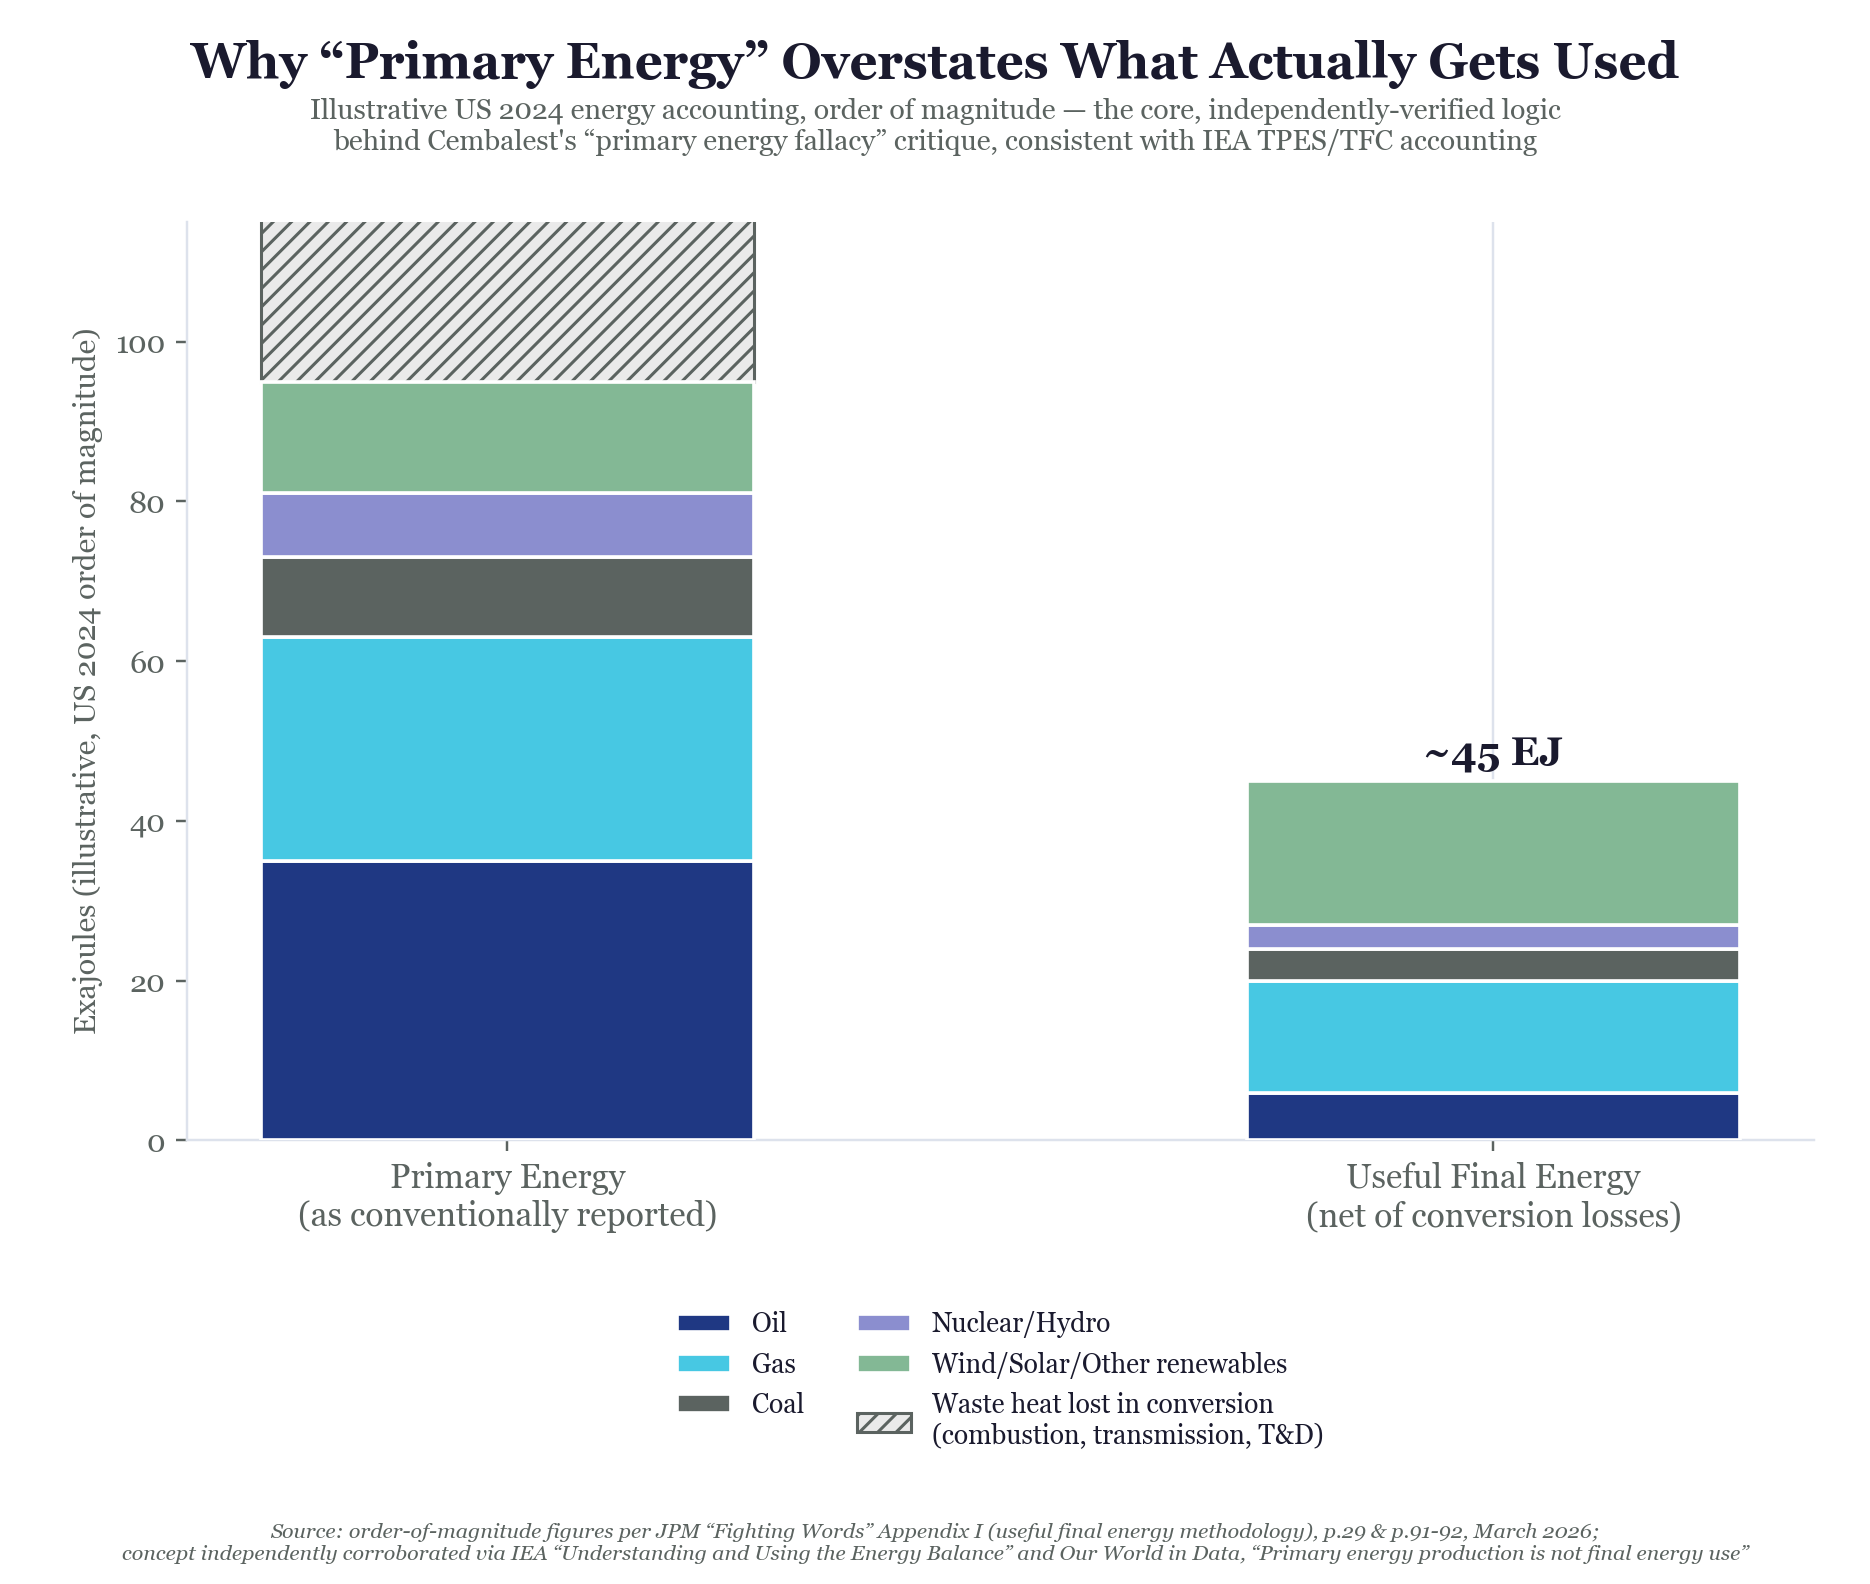
1. Core argument: primary energy overstates fossil share; UFE nets out waste heat
Correct, but not novel. This is established mainstream energy-statistics practice, not a Cembalest invention. The IEA's own distinction between Total Primary Energy Supply (TPES) and Total Final Consumption (TFC) embodies the same logic; Our World in Data's Hannah Ritchie has published near-identical arguments; and Vaclav Smil, who co-authored this same paper's essential-charts section, has written on this for decades. Cembalest's UFE goes one layer deeper than standard IEA final energy by also netting out motor and appliance losses, which is a genuine methodological contribution — but the foundational critique itself is consensus, not contrarian.
Source: IEA, "Understanding and Using the Energy Balance"; Our World in Data, "Primary energy production is not final energy use"
2. The "not that different" finding is explained by the substitution-method artifact
Correct, and independently and strongly corroborated. BP/Energy Institute's Statistical Review historically used a "substitution method" that inflates non-fossil electricity into an artificial primary-energy-equivalent using an assumed ~38-40% thermal efficiency — which mechanically offsets the waste-heat understatement on the fossil side and made primary-energy and UFE trends look more similar than they really are. Notably, the Energy Institute itself abandoned the substitution method in its 2025 Statistical Review, stating in its own words that it "made sense in a world fuelled almost entirely by oil, gas and coal but is no longer relevant to today's energy system" — the industry's own statistics body has now conceded the core of Cembalest's critique.
Source: Energy Institute, "About the Statistical Review"; Our World in Data, substitution method explainer
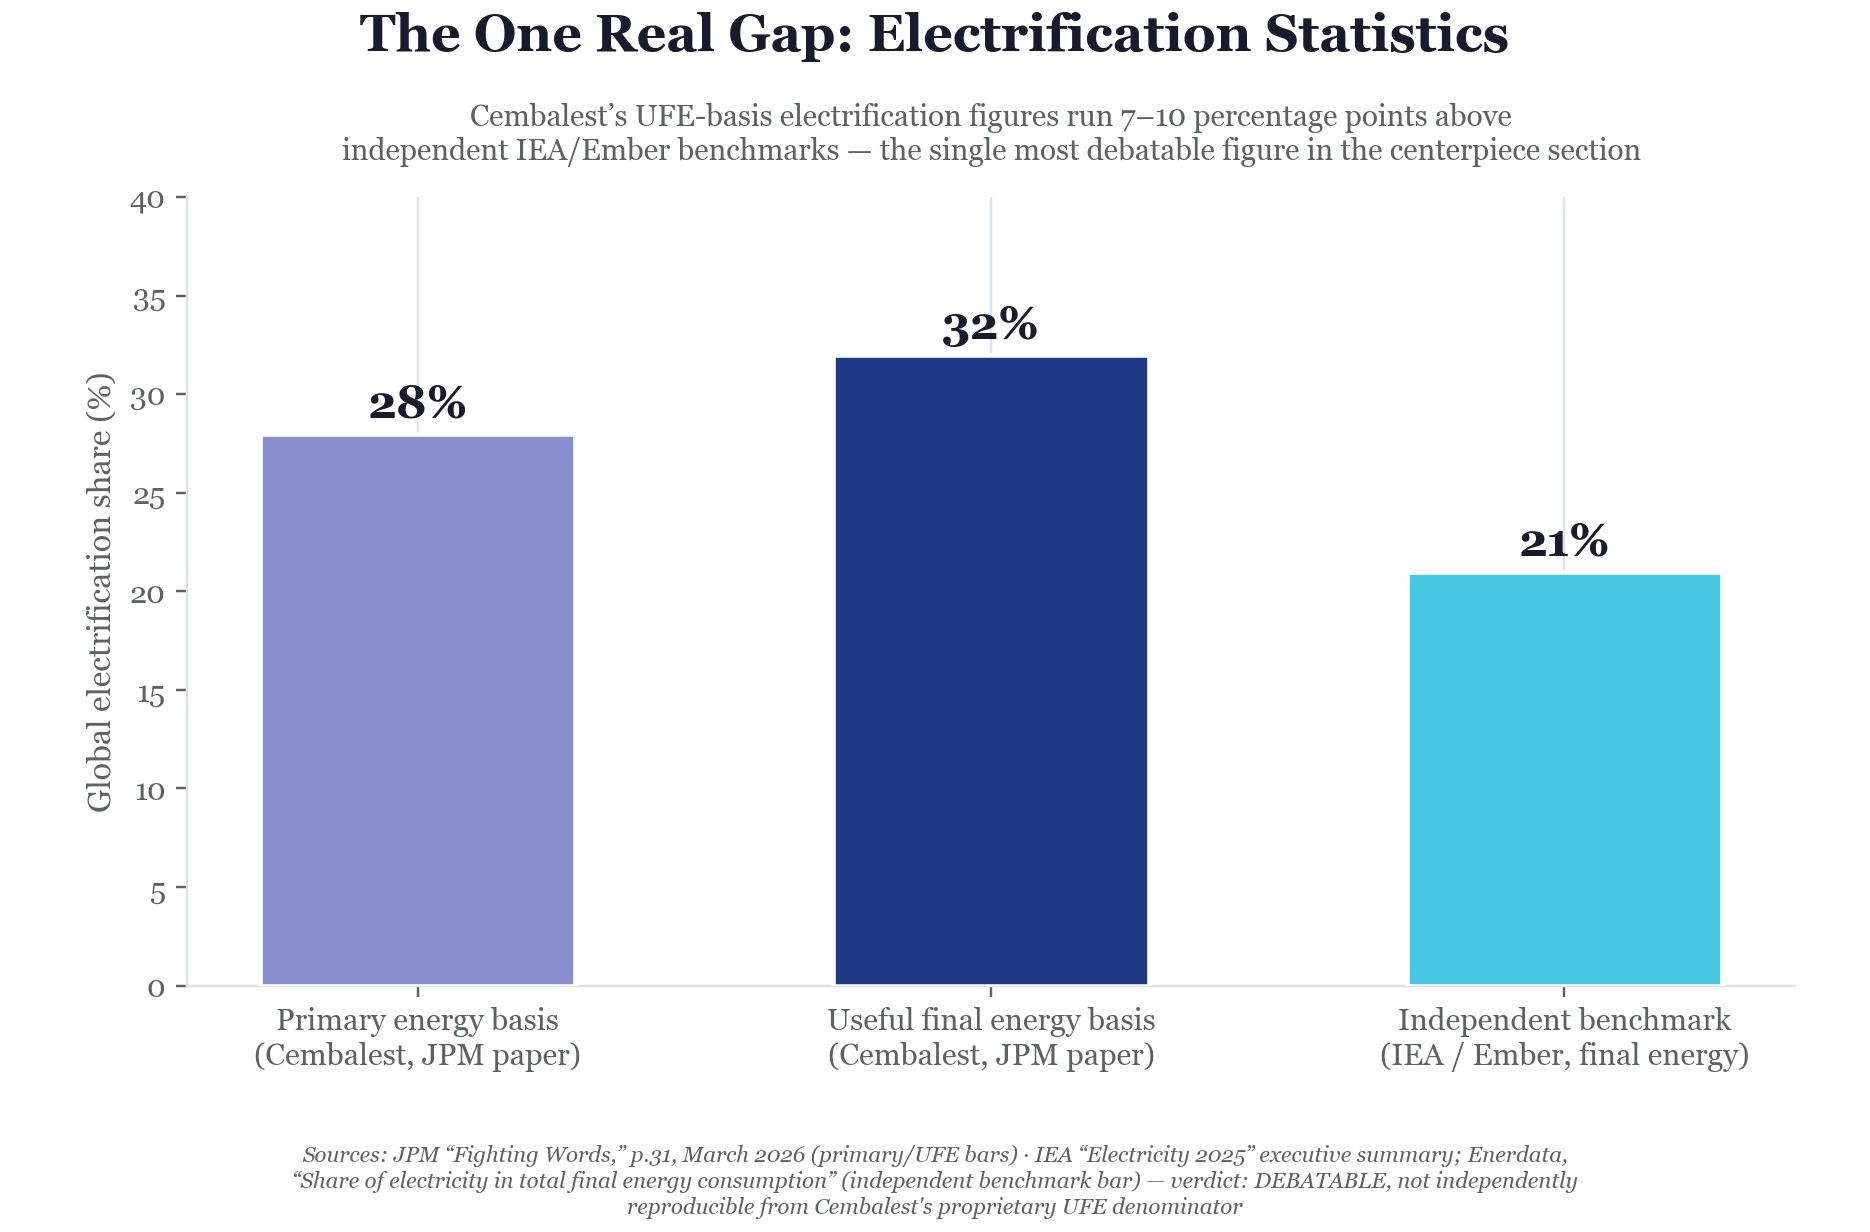
3. Electrification statistics: ~32% UFE vs. ~28% primary; US ranks #22 of 25
Debatable — the weakest point in the section. Independent IEA/Ember figures put global electricity's share of total final consumption at only ~20-22% (2023-2025), 7 to 10 percentage points below Cembalest's ~28-32% UFE-basis figures. This gap likely stems from his proprietary UFE denominator, which probably excludes low-quality traditional biomass that IEA counts inside TFC — a methodologically defensible choice, but one that is not independently reproducible from public data, and one that happens to flatter the "electrification is happening faster than you think" narrative. The specific claim that the US ranks #22 of 25 countries could not be verified or refuted against any public dataset; it is plausible but unconfirmed.
Source: IEA, Electricity 2025 Executive Summary; Enerdata, Share of Electricity in Final Consumption
4. Chris Wright "solar tweetstorm" and the LBNL 394 MWh/acre/year solar density figure
Correct, with one minor date error. US Energy Secretary Chris Wright's tweet is real, but it is dated September 2, 2025, not "August 2025" as the paper states. The LBNL figure is an exact match: LBNL's utility-scale PV land-use report, covering 736 plants totaling 35,482 MW-DC across 38 states from 2007 to 2019, reports a median of 394 MWh/acre/year for tracking systems — precisely as cited, not a rough approximation. E&E News's own independent fact-check of Wright's tweet reaches essentially the same "primary energy lens obscures electricity's real role" conclusion that Cembalest draws.
Source: X/@SecretaryWright, Sept 2, 2025; LBNL, Land Requirements for Utility-Scale PV; E&E News fact-check
5. Mark Jacobson lawsuit and the "98 of 116 days" critique
Correct, thoroughly verified against the actual DC Court of Appeals opinion and case history. Stanford's Mark Jacobson filed a $10 million defamation suit in September 2017 over Clack et al.'s 2017 PNAS critique of his 100%-renewables modeling; the suit was dismissed in February 2018, and $503,723 in anti-SLAPP attorney fees was awarded against Jacobson in 2020 — so "approximately $500,000" is accurate. On February 15, 2024, the DC Court of Appeals affirmed the fee award (Judge Joshua Deahl), including the "nothing more than his indignation" language Cembalest quotes. Notably, the "98 of 116 days, but as little as 5 minutes" critique is not a distortion of Jacobson's work — the 5-minute figure is Jacobson's own reported data, from his own paper's results section.
Source: DC Court of Appeals opinion, Jacobson v. Clack, 22-CV-0523; Retraction Watch, Feb 15, 2024
6. Tone and framing: extensive Jacobson litigation detail plus "zealots" / "manufactured outrage" language
Debatable — an editorial judgment, not a factual question. The facts recited are accurate (see Claim 5), but devoting this much space to one researcher's legal history, combined with pejorative labels like "zealots," is a rhetorical register a strictly data-driven paper does not need. It arguably attacks the messenger alongside the message.
Assessment: Gaiergy editorial judgment, based on the section's proportion of space and word choice relative to its factual content, June 2026.
7. EIA/DOGE staffing cuts of roughly one-third, and the Sieminski op-ed
Correct. Three independent outlets — ProPublica, S&P Global, and Bloomberg — converge on a roughly 29-30% EIA staffing cut in 2025, making "roughly one-third" a fair, non-exaggerated rounding. Adam Sieminski, EIA Administrator from 2012 to 2017, did publish "The Death of Energy Statistics We Can Trust" in The National Interest on July 18, 2025.
JPMorgan is simultaneously a major fossil-fuel financier and a major clean-energy asset manager. The UFE framework, if anything, cuts in a pro-electrification direction — it makes the case that fossil fuel's real economic role is shrinking faster than raw primary-energy statistics suggest. That is harder to read as serving fossil-financing interests than a paper minimizing stranded-asset risk would be.
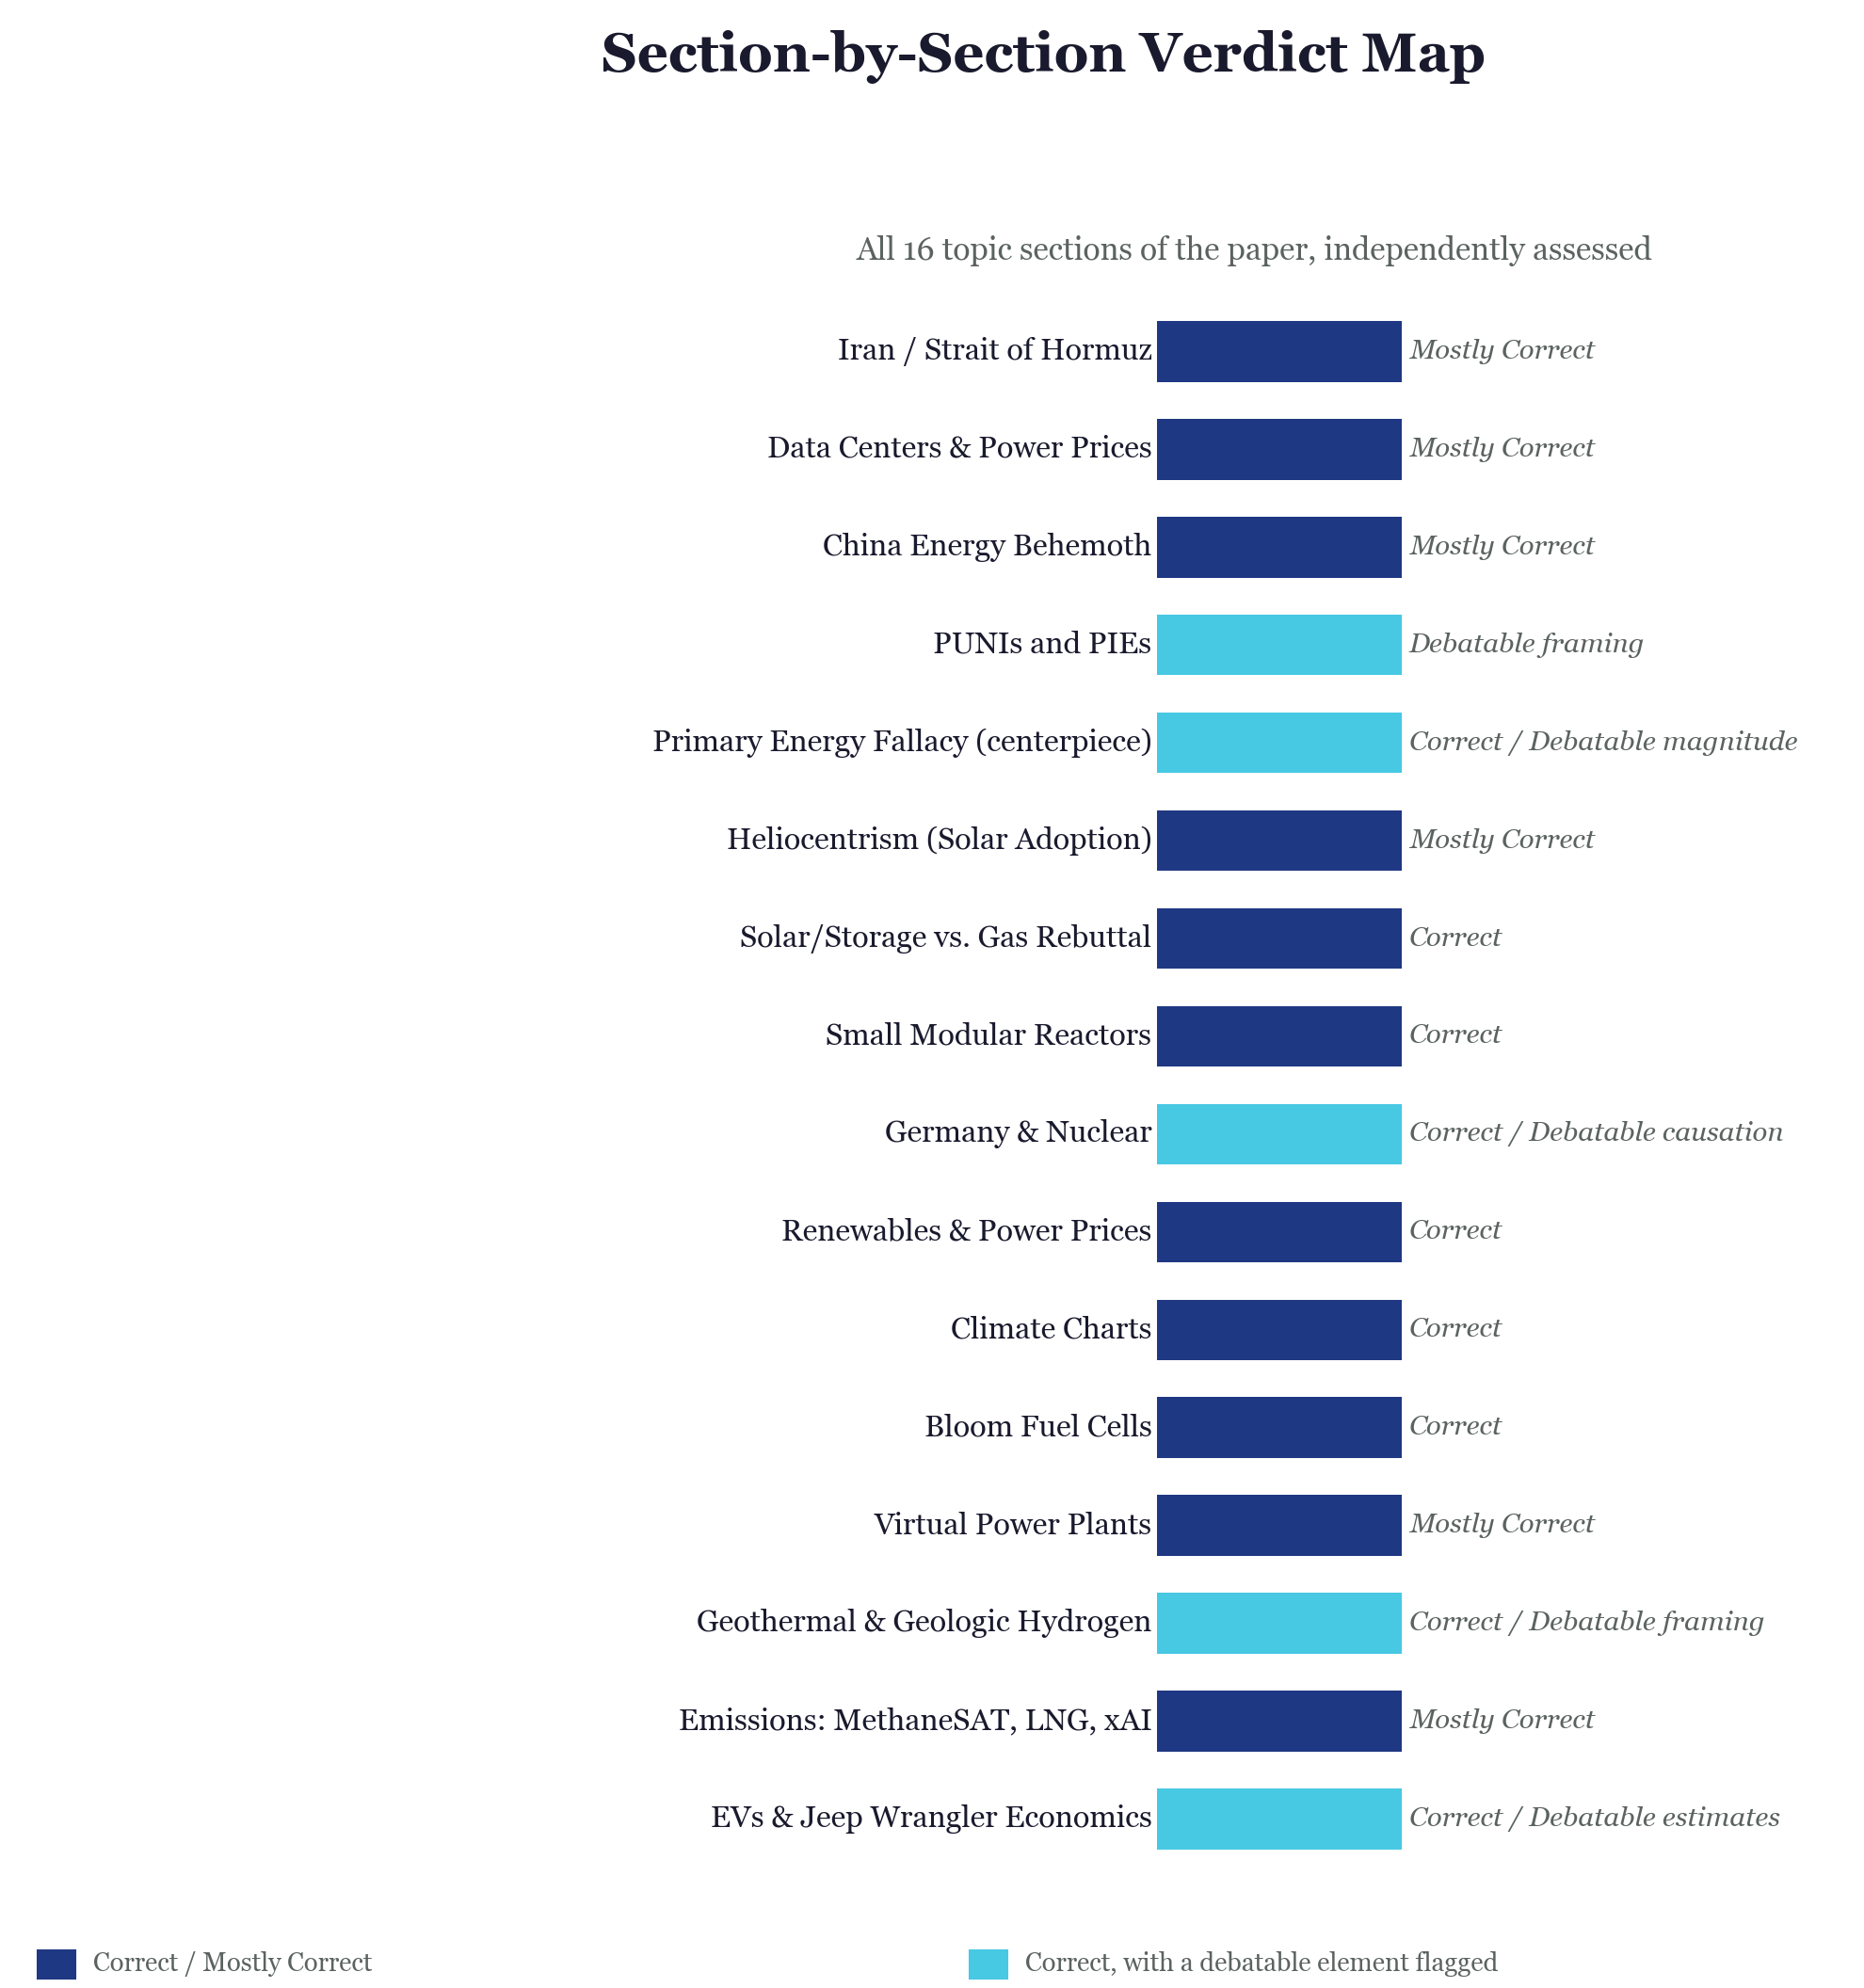
At a Glance
Section 1 · pp. 2-4
Hormuz oil (~20% of global consumption) and gas (~3%) transit shares
Correct — matches EIA's "World Oil Transit Chokepoints" series closely.
Source: US Energy Information Administration, World Oil Transit Chokepoints.
SPR drawdown numbers
Correct — inventory trajectory matches DOE/EIA data.
Source: US DOE / EIA Strategic Petroleum Reserve inventory data.
SPR drawdown framed as "anti-inflation, not geopolitical"
Debatable — one-sided. The Biden administration's stated rationale for the 2022 SPR release led with the Russia-Ukraine war supply shock, with inflation relief cited as a secondary benefit, not the reverse framing the paper implies.
Assessment: Gaiergy review of contemporaneous administration statements, June 2026.
Energy intensity of GDP falling since the 1990 Gulf War
Correct directionally; the precise "halved" magnitude is unconfirmed against a single authoritative dataset.
Source: Gaiergy cross-check against multiple energy-intensity series; exact halving figure not independently pinned to one dataset.
Section 2 · pp. 6-17
Retail power price framing (+2¢/kWh real, 1.4% of expenditures)
Debatable. The figures are real but unsourced in the paper itself, and lean toward the most industry-friendly permissible reading — real-dollar terms with no footnote — versus the more commonly cited nominal figures that show larger increases.
Assessment: Gaiergy review; no footnote provided in source paper for this figure.
EEI $1.3 trillion 2015-2024 capex, 13th consecutive record year
Correct — confirmed verbatim against the Edison Electric Institute's own July 2025 release — though the accompanying 34%/37% grid-hardening figures are stitched from a separate, older (2023) EEI/PPL document, a minor citation mismatch.
Source: Edison Electric Institute, July 2025 capital expenditure release.
LBNL load-growth and generation-cost price-driver findings
Correct — and notably, Cembalest's own footnote explicitly corrects a misreading of this LBNL study that would otherwise favor renewables skeptics, cutting against a cherry-picking reading of the paper.
Source: Lawrence Berkeley National Laboratory, load-growth and retail price-driver study.
PJM Monitoring Analytics data-center attribution, $530/MW-day uncapped price, and January 2026 White House/governors statement
Correct on all three — and notably, the primary Monitoring Analytics source actually supports a stronger data-center attribution (111-476%, depending on scenario) than the "75%" figure Cembalest cites, meaning if anything he understated his own source.
Source: PJM Independent Market Monitor (Monitoring Analytics), capacity market reports.
Virginia locational marginal price (LMP) study, Mamkhezri et al.
Correct on authors, mechanism, and the 7.3% headline figure; the precise $2.58/MWh figure and a renewable-tract sub-finding are Unconfirmed.
Source: Mamkhezri et al., Virginia LMP study, as cited in JPM paper; not independently reproduced at full precision.
Epoch AI / EPRI compute-power trajectory
Correct — verified against the actual Epoch AI / EPRI joint report.
Source: Epoch AI and Electric Power Research Institute (EPRI), joint compute-power report.
OpenAI 250 GW by 2033, 30.5 GW announced
Correct — arithmetic checks out: 250 GW is roughly one-third of the projected ~750-800 GW US peak demand.
Source: OpenAI infrastructure announcements as cited in JPM paper; cross-checked against US peak-demand projections.
BNEF gas demand growth of +3-4 bcf/day by 2030
Correct.
Source: Bloomberg New Energy Finance (BNEF).
Texas SB6 (data center grid-reliability legislation)
Correct — confirmed against actual bill text and law-firm summaries.
Source: Texas Senate Bill 6, enacted text.
25-plus 2025 data center cancellations totaling 4.7 GW
Correct — confirmed against HeatMap's own primary reporting, which is Cembalest's cited source.
Source: HeatMap News, 2025 data center cancellation tracking.
Ireland data center moratorium
Debatable and stale. The Dublin-region moratorium, which was never truly national, was actually lifted in December 2025 — roughly three months before this March 2026 paper published. Describing it as an ongoing moratorium is outdated, though the paper's description of the successor policy, which now requires behind-the-meter generation, is accurate.
Source: Gaiergy review of Irish grid operator (EirGrid) policy updates, December 2025.
Section 3 · pp. 18-27
China energy consumption versus US plus Europe combined
Correct, but the margin is closer than the word "exceeds" implies — China's consumption is approximately equal to the US and Europe combined, not dramatically above it.
Source: Gaiergy cross-check against international energy consumption statistics.
Carbon Brief: China coal decline of ~1.6%, first since the 1970s
Correct.
Source: Carbon Brief, China coal consumption analysis.
Yuan et al., Nature Climate Change land-use carbon sink paper
Correct.
Source: Yuan et al., Nature Climate Change.
China manufacturing dominance: 85-98% of PV, magnets, and batteries
Correct — IEA-sourced figures match.
Source: International Energy Agency (IEA), clean-energy supply chain reports.
Rare earth export control timeline (April/October 2025, fentanyl tariff swap)
Correct — the three-stage sequence is confirmed.
Source: Gaiergy review of contemporaneous trade policy reporting, 2025.
Baotou toxic lake, 2012 State Council language, Yale Environmental Performance Index scores
Correct.
Source: Yale Environmental Performance Index; Chinese State Council public records, 2012.
Volt Typhoon cyber campaign, port cranes, FBI Director Wray quote
Correct — verbatim quote confirmed.
Source: FBI public statements on Volt Typhoon; congressional testimony records.
2010 Westinghouse AP1000 hack, 2014 DOJ indictment
Correct.
Source: US Department of Justice, 2014 indictment records.
China nuclear build scale, cost, and build-time
Correct — the "32 reactors" figure is a slightly dated snapshot but within normal range.
Source: Gaiergy cross-check against international nuclear reactor databases.
EAST/WEST fusion records, HL-3 temperature milestone
Correct, with one correction: the record-breaking reactor was specifically France's WEST tokamak, not a generic "French reactor," and it broke China's prior record within weeks — February 18, 2025 — not months later as might be implied.
Source: Gaiergy review of fusion research program announcements, Feb 2025.
CATL sodium-ion battery specifications
Correct as a characterization of CATL's own, unvalidated claims — the independent-validation caveat Cembalest includes is fully warranted.
Source: CATL corporate disclosures, as characterized in JPM paper with appropriate caveat.
Yarlung Zangbo hydro project, 60 GW, ~2-3% of China's electricity
Correct — the "2-3%" claim is essentially exact.
Source: Gaiergy cross-check against Chinese hydropower project announcements.
Debatable. The section's manufacturing-dominance claims rest on clean IEA data, while its "cost of dominance" claims stack curated dramatic anecdotes — one toxic lake, one decade-old hack, one crane investigation — without equivalent scrutiny of comparable US or Gulf-state environmental or security track records elsewhere in the paper. Every individual fact checks out; the juxtaposition is advocacy-structured, not neutral scorekeeping.
Section 4 · p. 28
76 countries above 50% renewable = 14% of global generation; 75%-plus = 5%
Correct in shape, though not independently reproducible to the exact percentage from public EMBER data.
Source: Gaiergy cross-check against EMBER global electricity data.
PUNI countries are roughly 75% hydro
Correct for the named examples: Iceland, Norway, Paraguay.
Source: Gaiergy cross-check against national electricity generation mix data.
Denmark 77% import share
Debatable and Unconfirmed at the precise-decimal level — plausible given Denmark's unusual position as a grid crossroads, both importing and exporting large volumes relative to consumption, but not independently reproducible from public trade statistics.
Source: Gaiergy attempted cross-check against public European grid trade statistics; precise figure not reproducible.
15 largest generators at roughly 1-2% import/export reliance
Correct for imports specifically; the claim modestly undersells export-side outliers such as Germany at 12% and France at 25%.
Source: Gaiergy cross-check against national grid trade statistics.
"PIE" (Parasitically Irrelevant Examples) framing
Debatable. The quantitative point — that small countries' resource endowments are not replicable at scale — is fair. The pejorative label discourages readers from considering transferable market-design or policy lessons that do not actually depend on resource endowment.
Assessment: Gaiergy editorial judgment, June 2026.
Section 6 · pp. 34-36
Global solar capacity and generation-share trajectory
Correct directionally.
Source: Gaiergy cross-check against global solar capacity statistics.
Chinese solar manufacturer losses
Correct and confirmed in detail. FY2024 net losses were independently confirmed against company filings and press releases: LONGi (-RMB 8.6 billion), Trina (-RMB 3.4 billion), GCL/GCL Technology (-RMB 4.75 billion), JA Solar (-RMB 4.66 billion), and Daqo (-$345.2 million). Profitable exceptions were also confirmed: First Solar (+$1.29 billion FY2024, though roughly 27% of that net income is directly attributable to Section 45X tax credit cost-of-sales benefit, meaning "profitable" is meaningfully tax-credit-assisted), CSI Solar (+RMB 2.25 billion FY2024), and DMEGC (+RMB 1.83 billion FY2024, though DMEGC is a diversified company where only about 60% of revenue is solar, so its consolidated profit is not a pure solar-segment figure). Beijing's mid-2025 "anti-involution" policy campaign targeting solar, battery, and EV overcapacity is real and well documented, including NDRC/MIIT capacity-retirement funds and CPIA self-discipline pricing pledges.
Source: Company FY2024 filings and press releases (LONGi, Trina, GCL, JA Solar, Daqo, First Solar, CSI Solar, DMEGC); NDRC/MIIT and CPIA policy announcements, 2025.
US 2025 utility-scale solar installs (~35 GW, "slightly less than 2024")
Debatable and imprecise. SEIA/Wood Mackenzie data shows 41 GW-DC of utility-scale capacity built in 2025 against a total-market decline of 14% year-over-year; exact figures vary meaningfully by report vintage, revision, and DC-versus-AC conventions, but the general direction — that solar growth is moderating — is correct.
Source: SEIA / Wood Mackenzie US Solar Market Insight reports.
Perovskite-silicon tandem cell degradation limiting commercialization
Correct directionally. Independent literature confirms stability is "the single largest bottleneck" to commercial deployment, with the longest public operational data around 1,000 hours against a 25-year warranty need. The precise "80% efficiency loss in under a year" figure was not independently pinned to one specific study but is consistent with the broader degradation literature.
Source: Gaiergy review of perovskite-silicon tandem cell stability literature.
Section 7 · pp. 43-48
LCOE understates system costs of variable renewables at high penetration
Correct and mainstream consensus, not a fringe Clean Air Task Force (CATF) or nuclear-advocacy view. This is independently confirmed via the IEA/NEA's Value-Adjusted LCOE (VALCOE) methodology in use since 2018, Lazard's own "LCOE+" firming-cost additions, NREL value-deflation research, and the founding academic literature: Joskow (MIT, 2011), Hirth (Potsdam, 2013), and the EIA's own Levelized Avoided Cost of Electricity (LACE) metric in use since 2014. CATF is applying, not originating, this consensus.
Source: IEA/NEA VALCOE methodology; Lazard LCOE+ reports; NREL value-deflation research; Joskow (2011); Hirth (2013); EIA LACE methodology.
CATF's May 2025 "Beyond LCOE" paper
Correct, verified verbatim against the actual PDF — every substantive claim Cembalest attributes to it is accurately quoted.
Source: Clean Air Task Force, "Beyond LCOE," May 2025.
EMBER's June 2025 report ($104/MWh, 97% of hours, Las Vegas, 6 GW solar / 17 GWh storage)
Correct, confirmed against Ember's own published report and press materials — Cembalest's characterization is accurate.
Source: Ember, June 2025 solar-plus-storage cost report.
Cembalest's rebuttal that EMBER used an unrealistically low, China-weighted solar capex figure ($436/kW)
Correct and substantive. NREL's own Annual Technology Baseline (ATB) benchmark for US utility-scale solar sits around $1,400-1,430/kW in the 2024/2025 vintage — more than three times EMBER's assumed figure. This is a legitimate, well-grounded critique, not a stacked-assumptions strawman.
Source: NREL Annual Technology Baseline (ATB), 2024/2025 vintage.
ERCOT battery arbitrage revenue collapse
Correct and precisely matched. Confirmed 2025 revenues of approximately $29.4/kW versus 2024's $56/kW and 2023's $193/kW — an approximately 85% collapse from the 2023 peak — driven by ancillary-services market saturation as battery capacity grew roughly 70x since 2020, including 9 GW added in 2024-2025 alone, exactly as Cembalest describes.
Source: ERCOT battery storage revenue data, 2023-2025.
Section 8 · pp. 37-40
SMR funding and DOE awards (TerraPower $650 million, X-Energy $700 million, December 2025 $800 million DOE/TVA/Holtec awards)
Correct.
Source: US Department of Energy award announcements.
Macfarlane & Kim (2025), Progress in Nuclear Energy, $200-400/MWh SMR cost estimate
Correct. The paper is verified real; exact dollar figures are consistent with secondary reporting, though the full paywalled text was not directly read.
Source: Macfarlane & Kim, Progress in Nuclear Energy, 2025 (secondary reporting cross-check).
TVA 2025 Integrated Resource Plan (IRP), $18,000/kW first-of-a-kind (FOAK) SMR cost
Correct — the capital cost figure was verified via secondary industry reporting; the derived $196/$150 MWh LCOE figures are Unconfirmed at the primary-document level but directionally consistent with independent literature.
Source: TVA 2025 Integrated Resource Plan (secondary reporting cross-check).
China HTR-PM reactor availability, ~30% in 2024
Debatable. Very low early-years availability is well documented, at 10% in 2022-2023, but the precise "2024: ~30%" figure is Unconfirmed.
Source: Gaiergy review of HTR-PM operational reporting.
China ACP100/CNNC 2x cost admission
Unconfirmed — could not be traced to a primary China National Nuclear Corporation (CNNC) source.
Source: Not independently located; treat as unconfirmed pending primary CNNC documentation.
Trump February 2025 executive order on NRC/OMB independent-agency oversight
Correct — Executive Order 14215 (February 18, 2025), plus a more NRC-specific May 2025 executive order, confirmed via multiple law-firm and Bulletin of the Atomic Scientists sources.
Source: Executive Order 14215, Feb 18, 2025; Bulletin of the Atomic Scientists.
Fukushima National Diet "collusion" quote
Correct, verbatim quote confirmed against the official 2012 National Diet of Japan Fukushima Nuclear Accident Independent Investigation Commission (NAIIC) report.
Source: NAIIC official report, 2012.
German Chancellor Friedrich Merz, "serious strategic mistake" (January 2026)
Correct, confirmed via multiple independent January 2026 outlets, including NucNet and Anadolu Agency.
Source: NucNet, Jan 2026; Anadolu Agency, Jan 2026.
Germany 25% higher electricity prices attributed to nuclear phase-out
Debatable. The well-known independent academic paper on this topic, Jarvis, Deschênes & Jha (NBER 2019 / JEEA 2022), finds the phase-out was costly, at roughly €3-8 billion per year, but via a different mechanism: mortality from added fossil-fuel air pollution, not a direct 25% price uplift. Cembalest's specific 25% figure appears to be JPM's own proprietary modeling, not independently reproducible or corroborated by the academic literature he might be implicitly leaning on.
Source: Jarvis, Deschênes & Jha, NBER Working Paper 2019 / Journal of the European Economic Association 2022.
Germany industrial electricity price differential (~3x US/China) and deindustrialization
Correct on the price differential, which falls in a 2-3x range depending on methodology. Debatable on causal attribution: independent literature, including the Draghi Report and CEPR's "China Shock 2.0" analysis, shows German industrial decline is genuinely multi-causal — lost Russian gas, Chinese competition, EV transition costs, and broader EU competitiveness deficits — not clearly dominated by energy prices alone.
Source: Draghi Report (EU competitiveness report); CEPR, "China Shock 2.0" analysis.
Submarine nuclear reactor cost comparison ($14.2 million/MWt vs. Vogtle $5.4 million/MWt)
Unconfirmed — no public source disaggregates naval reactor cost from total hull cost. This figure should be treated as illustrative and non-primary-sourced.
Source: Not independently locatable in disaggregated form; treat as illustrative only.
Section 9 · pp. 41-42
Methodological critique: generation-cost-only comparisons omit grid cost and taxpayer subsidies
Correct — a fair and standard point in energy and public economics.
Source: Standard energy economics literature on full-cost accounting.
IRA subsidy cost ($341 billion original estimate vs. Goldman Sachs $1.2 trillion)
Debatable. Goldman's $1.2 trillion figure is confirmed exactly. The $341 billion figure does not cleanly trace to a single CBO/JCT source; commonly cited original estimates run $369-400 billion, so the $341 billion figure should be treated as imprecise.
Source: Goldman Sachs research (confirmed); Congressional Budget Office / Joint Committee on Taxation original IRA cost estimates (range, not single figure).
EU $700 billion in renewable subsidies, 2015-2023
Correct — independently verified by summing the actual European Commission report's own Figure 4 data, which totals to €706 billion.
Source: European Commission report, Figure 4 (independently summed by Gaiergy).
Three-camp literature review: renewables lower prices / raise prices / mixed evidence
Correct — a genuinely balanced, non-cherry-picked representation of a real empirical split. Five of six cited studies were independently confirmed with accurate headline characterizations.
Source: Gaiergy independent review of the six studies cited in this section.
Section 10 · p. 49
CO2 concentration, ocean heat content, ice sheet mass loss, Hawaii ocean acidification
Correct — all independently confirmed against NOAA/NASA data with no distortion found. If anything, the paper's cited 2024 annual CO2 increase of approximately 3.5 ppm is a touch conservative versus NOAA's own reported record of 3.75 ppm.
Source: NOAA and NASA climate indicator datasets.
Section 11 · pp. 50-51
Capex ($3,000-4,000/kW), efficiency (~55% LHV), CO2 intensity (~800 lbs/MWh), China rare-earth 10-Q disclosure
Correct, all confirmed against SemiAnalysis reporting and Bloom Energy's own SEC filings and datasheets.
Source: SemiAnalysis; Bloom Energy SEC 10-Q filings and product datasheets.
Brookfield $5 billion partnership
Correct, but now outdated — the partnership has since been expanded 5x to $25 billion as of a June 2026 announcement, a useful update flag for anyone reading this paper today.
Source: Brookfield / Bloom Energy partnership announcement, June 2026.
Section 12 · pp. 52-53
Wood Mackenzie VPP growth statistics (35%/33%/14% to 37.5 GW) and DOE 80-160 GW / $10 billion "liftoff" figures
Correct, confirmed verbatim against both primary sources.
Source: Wood Mackenzie VPP market report; US DOE Liftoff report.
July 29, 2025 CAISO test event (535 MW, ~100,000 batteries)
Correct on the event itself; Debatable on the precise 1.7% net-peak-reduction figure — independent reporting cites 1.9%, a real but minor discrepancy.
Source: CAISO event reporting, July 2025; independent secondary reporting citing 1.9%.
Leap/Tesla June 2025 dispatch figures (546 MWh, 12,125 DERs, 345 MW)
Unconfirmed — these specific figures and dates could not be verified, and may represent conflation with a different, better-documented California event (Tesla's July 29 test, above).
Source: Not independently located; treat as unconfirmed pending primary Leap/Tesla documentation.
Section 13 · pp. 54-59
~80% of geothermal used as heat; China/US/Turkey ~65% of production
Debatable — this conflates a heat-dominant statistic, where China leads, with a power-dominant statistic, where China is nearly absent and the US and Turkey lead electricity generation, in a way that could overstate China's role in geothermal power specifically.
Assessment: Gaiergy review of geothermal heat-vs-power statistics by country.
Fervo Energy Sugarloaf well specs (16,000 ft, 270°C, 16 days, 50-60% thermal recovery)
Correct, confirmed against Fervo's own press release; the paper's "79% faster than DOE benchmark" claim rounds fairly to "80%."
Source: Fervo Energy press release, Sugarloaf well results.
NREL LCOE figures and the "National Laboratory of the Rockies" rename
Correct — and notably, NREL's rename to "National Laboratory of the Rockies," effective December 1, 2025, is real, not a research error, reflecting a DOE branding shift away from "renewable energy" terminology.
Source: US Department of Energy / NREL rebranding announcement, effective Dec 1, 2025.
Ellis & Gelman USGS geologic hydrogen resource paper
Correct, verified against the actual Science Advances paper; Cembalest's "~1.7x" energy-of-proven-gas-reserves figure is actually more mathematically precise than the commonly-rounded "2x" headline.
Source: Ellis & Gelman, USGS, Science Advances.
Mali and Albania natural hydrogen well production figures
Correct, both independently confirmed — Albania's approximately 200 tonnes/year figure matches published CNRS/Grenoble research exactly.
Source: CNRS / Grenoble research on Albanian natural hydrogen seep.
Section 14 · pp. 60-61
MethaneSAT findings (basins 50% above inventory estimates) and satellite failure timeline
Correct — the satellite genuinely lost contact on June 20, 2025; the "May 2024-June 2025" observation window legitimately predates the failure, so there is no contradiction. The underlying data was not yet peer-reviewed as of release, a caveat worth flagging.
Source: MethaneSAT mission reporting, 2024-2025.
UT Austin LNG supply chain LIDAR study (20-40% higher emissions than inventories)
Debatable and partially unconfirmed. A real UT Austin research program exists, but the exact framing, including "six stages," a "three-year campaign," and the precise 20-40% figure, could not be pinned to one single paper and may synthesize across a family of related studies.
Source: UT Austin LNG supply-chain emissions research program (multiple related studies).
xAI Memphis "Colossus" regulatory saga (mobile turbines, waiver, NOx, January 2026 EPA dual ruling)
Correct, thoroughly confirmed; the specific "122 days" construction claim and the Mississippi "Colossus II" detail are Unconfirmed.
Source: EPA regulatory filings and rulings, Jan 2026; contemporaneous news reporting on xAI Memphis facility.
NOx health studies (Louisville coal retirement; 11-17% hospitalization study)
Correct, both studies independently verified with figures matching precisely. Note: the Louisville study was published in Nature Energy in 2020, not 2022 as might be implied — a minor date correction.
Source: Louisville coal-retirement health study, Nature Energy, 2020.
Section 15 · pp. 62-63
PSEG-LI (Long Island) rate structure
Correct structurally — the Standard/Optional Time-of-Use (TOU) plan architecture is confirmed; the precise cent-per-kWh figures are Unconfirmed via public fetch. Gaiergy recommends direct verification of exact rates before republishing.
Source: PSEG Long Island rate schedule structure (confirmed); exact rates not independently re-verified.
Wrangler 4xe recalls (power loss, coolant, high-voltage battery fire/park-outside order)
Correct — all three are real, current NHTSA actions.
Source: National Highway Traffic Safety Administration (NHTSA) recall database.
Wrangler 4xe specifications (22 miles electric range / 17 kWh battery / 20 mpg)
Correct, arithmetic checks out exactly.
Source: Manufacturer specifications, cross-checked by Gaiergy.
Section 16 · p. 64
EV operating margins by manufacturer
Debatable. Directionally correct — Tesla, BYD, and other Chinese leaders show positive margins while most legacy OEMs are negative — but the paper blends disclosed figures with likely JPMAM estimates without clearly labeling which is which; most non-Chinese, non-Tesla OEMs do not publicly disclose EV-specific operating margins.
Assessment: Gaiergy review; margin figures for most legacy OEMs are not independently disclosed and are likely modeled estimates.
Stellantis $26 billion, GM $6 billion, Ford $19.5 billion writeoffs
Correct, all three independently confirmed, including the Stellantis "freedom of choice" quote verbatim.
Source: Stellantis, GM, and Ford public financial disclosures.
EV tax credit expiration, September 30, 2025 (OBBBA)
Correct.
Source: One Big Beautiful Bill Act (OBBBA) statutory text.
Essential Charts Section · pp. 65-90
US energy independence "for the first time in ~40 years"
Debatable. The actual EIA figure is 67 years, since 1952, not approximately 40 years — a meaningful magnitude discrepancy, though the "first time in decades" direction is correct. Also worth noting: oil specifically, meaning crude and unblended, was not yet a net-export position as of 2024 — it is total petroleum and total energy where the flip occurred.
Source: US Energy Information Administration, US net energy trade position history.
Global CCS capacity growth (51 to 64 Mtpa)
Correct, confirmed against the Global CCS Institute's 2025 report almost exactly.
Source: Global CCS Institute, 2025 report.
Green hydrogen electricity cost share (60-70%) and 3-4x cost versus grey/blue hydrogen
Correct on the electricity cost share; the "even if electricity were free" extrapolation is Cembalest's own inference, not a direct quote from his cited source, though it is a reasonable inference from the underlying cost breakdown.
Source: Gaiergy cross-check against green hydrogen cost-breakdown literature.
2025 hydrogen-transportation setback list
Debatable — mostly correct. Hype, Shell, BP, Stellantis, and the Nikola/Hyzon/Quantron bankruptcies, plus the Airbus hydrogen-aircraft delay, are all confirmed. However, Daimler and MAN are overstated as "withdrawals" — both remained actively engaged in hydrogen trucking as of late 2025: Daimler delayed rather than exited, and MAN actually launched a new hydrogen combustion truck line.
Source: Gaiergy review of individual company hydrogen program announcements, 2025.
Sustainable Aviation Fuel (SAF) usage below 1% versus ~10% 2030 target
Correct, confirmed against the International Air Transport Association's (IATA) own statements.
Source: IATA public statements on SAF adoption targets.
Sustainable motor fuels: renewable diesel/biodiesel ~6%, ethanol ~7%
Debatable — partially correct. Ethanol's share is understated if measured by volume; the EIA confirms approximately 10% by volume via near-universal E10 blending. The "~7%" figure only holds on an energy-content-adjusted basis, which should be labeled as such if repeated.
Source: US Energy Information Administration, ethanol blending and volume statistics.
Closing Analysis
1. Exceptionally well-footnoted for the genre — the vast majority of claims trace cleanly to real, findable primary sources.
2. Self-correcting in places — the paper proactively corrects misreadings of its own cited sources, such as the LBNL price-driver study, rather than exploiting ambiguity.
3. Willing to publish findings against its own apparent priors — for example, the PJM Monitoring Analytics attribution is understated relative to what the source actually shows, and the EMBER/CATF LCOE critique engages seriously with a genuinely mainstream, not fringe, economic literature.
4. Consistent, well-grounded skepticism of SMR and green hydrogen economics, corroborated by independent peer-reviewed and DOE-lab literature.
1. A small number of stale or imprecise figures: the Ireland moratorium status, the US energy-independence "40 years" claim versus the actual 67 years, the Daimler/MAN hydrogen "withdrawal" overstatement, and minor date errors on the Wright tweet and the China fusion record.
2. Occasional rhetorical and editorial framing that outruns the underlying data's neutrality — the Jacobson lawsuit treatment and "zealots" language in the primary-energy-fallacy section, the "Parasitically Irrelevant Examples" label for small-country renewable leaders, and the China section's asymmetric curation of "cost of dominance" anecdotes versus clean manufacturing-dominance statistics.
3. A few claims rest on Cembalest's own proprietary JPMAM modeling that cannot be independently reproduced, including Germany's 25% price-uplift figure and the UFE electrification percentages. These are not wrong, but readers should recognize where the paper shifts from citing external data to presenting the author's own black-box calculations.
4. No outright fabrications or Wrong verdicts were found across approximately 85 checked claims — this is a genuinely careful piece of work, even where its framing choices are contestable.
"Fighting Words" earns its reputation as one of the more rigorously sourced pieces of annual energy commentary in finance. Gaiergy's independent check found no fabricated facts. The paper's real vulnerabilities are in framing, not fact: a rhetorical register that sometimes editorializes past what the data alone supports, a few stale figures that need updating, and several proprietary calculations that readers should not mistake for independently verifiable statistics. Readers should feel comfortable citing the overwhelming majority of this paper's factual claims, while flagging the specific debatable and unconfirmed items identified above before repeating them without qualification.
Reference
Full Source List
This report independently fact-checks Michael Cembalest, "Fighting Words," J.P. Morgan Asset & Wealth Management Eye on the Market, 16th Annual Energy Paper, March 3, 2026 (98 pages). Below are the primary and secondary sources consulted by Gaiergy across all sections.