
There are two battery-price stories on the internet right now, and a developer should trust neither at face value.
The first is the viral one: “BYD’s $20 Battery Just Killed the Last Argument Against Renewables” (The Electric Viking, 29 June 2026). I went looking for that $20 battery. It does not exist; the figure is a derived cost-per-cycle equivalence, not a price anyone quoted, and BYD never stated the $40/kWh sodium target the video builds on (BYD’s actual statement was about cycle life, with timing left open, per CnEVPost, 9 Feb 2026).
The second story is the analyst one: BloombergNEF (BNEF) and Wood Mackenzie publish tidy global averages, Chinese systems at $73/kWh, a global pack at $108/kWh, US systems at $219/kWh. Cleaner, more credible, and still not the number that shows up on a US developer’s bill. So I did what the headlines do not: I went to the actual install data, EIA filings, lab benchmarks, and real supplier quotes, to answer one question. What does a battery energy storage system (BESS) actually cost to put in the ground in the United States?
What real US installs actually cost
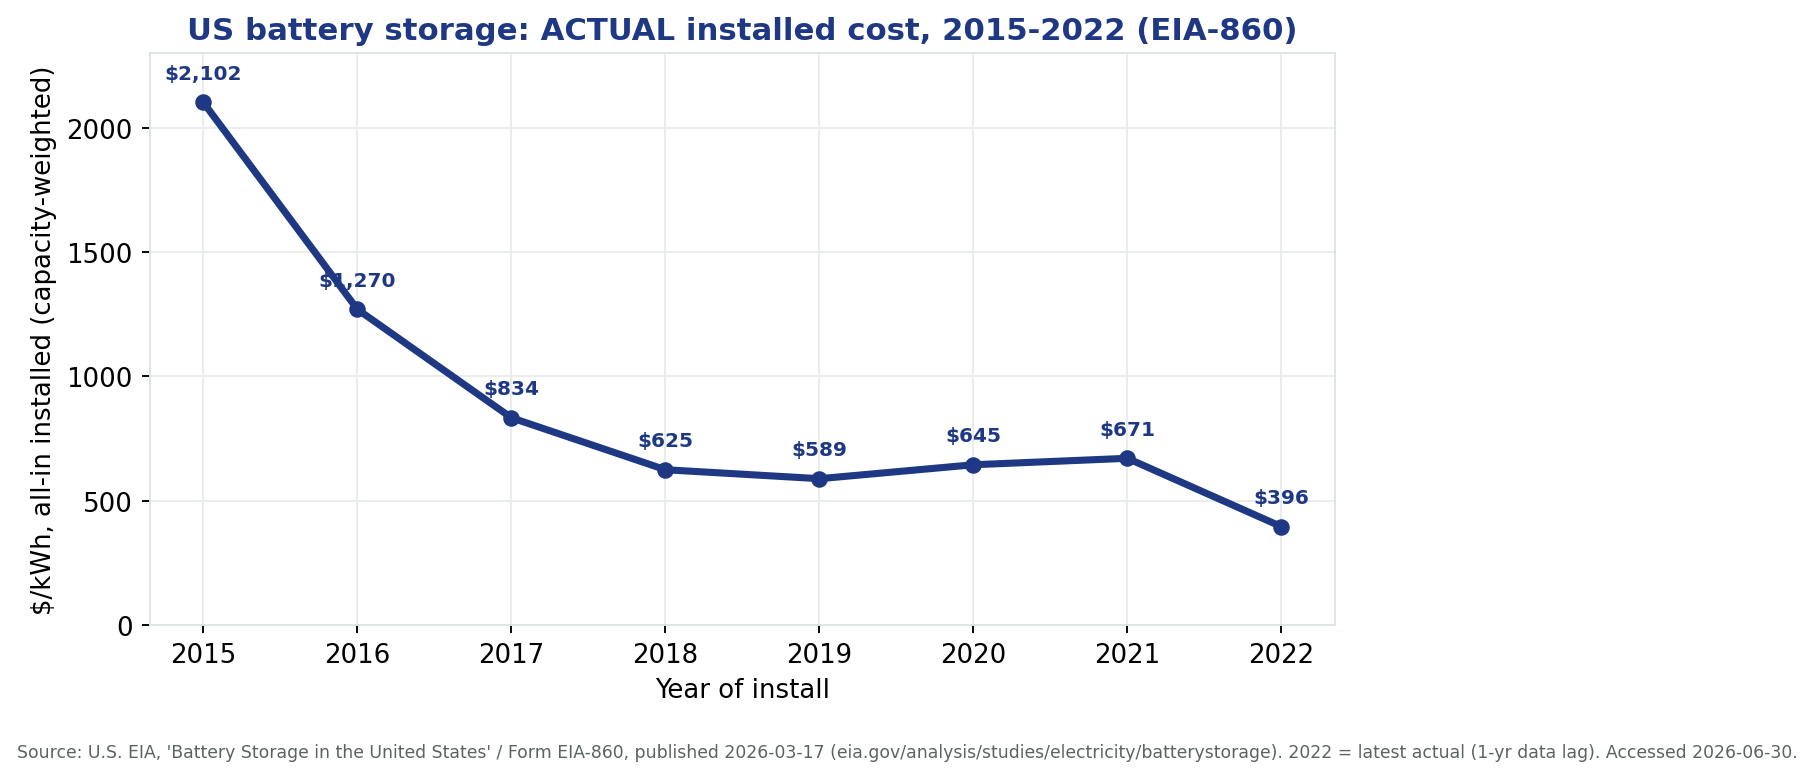
Start with the most empirical source we have. The US Energy Information Administration (EIA) collects actual, owner-reported capital costs for every large-scale battery project through Form EIA-860. Their latest release puts the capacity-weighted average all-in installed cost at $396/kWh ($1,205/kW) for systems that came online in 2022, the most recent year with actual data (EIA, 17 March 2026). That series has fallen hard from about $2,102/kWh in 2015, but $396/kWh is the real, all-in, paid number, not a forecast.
Lawrence Berkeley National Laboratory (LBNL) tracks the same thing from project commercial-operation data, and its figure is higher and more current: $458/kWh all-in installed for projects reaching operation in 2024, up from $381/kWh in 2023 (LBNL, October 2025). NREL’s bottom-up benchmark, built from real component and engineering quotes, lands at $334/kWh for a 4-hour standalone system in 2024 dollars (NREL ATB 2025 update).
Now the equipment-only layer, where the cheap numbers live. The Anza procurement index, drawn from actual supplier quotes to US buyers, shows distribution-scale systems at about $203/kWh for an AC turnkey package and $175/kWh for a DC block in Q1 2026 (Anza via Utility Dive, 7 April 2026). Tesla’s Megapack, the closest thing to a public list price, runs roughly $224 to $266/kWh for hardware and around $290/kWh installed (Tesla pricing, 2024-2025).
The scope ladder is the whole game
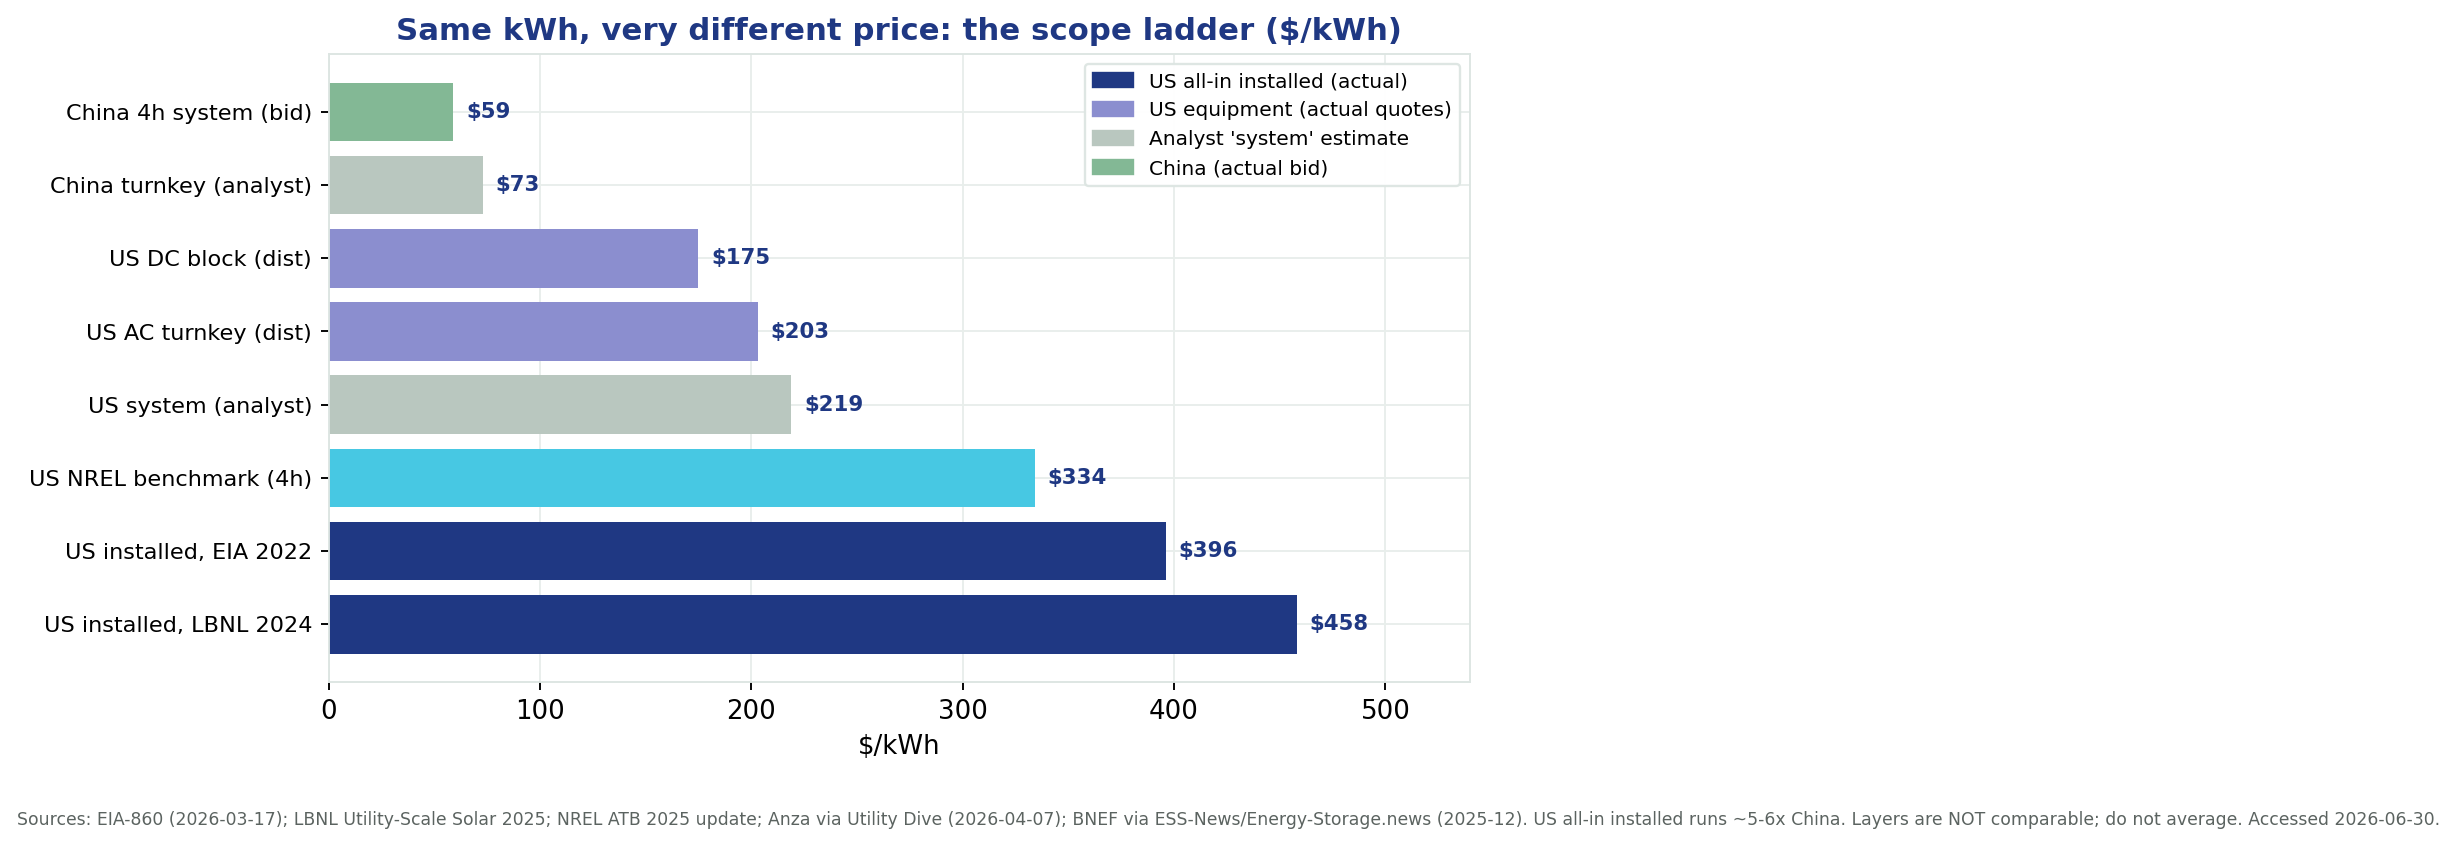
A raw cell is not a DC block; a DC block is not an AC turnkey system; and none of those is the all-in installed cost that includes interconnection, land, controls, integration, owner’s soft costs, and financing. The gap between the cheapest equipment quote and the actual installed number is not waste, it is everything the headline price leaves out. A US all-in installed project runs roughly five to six times the Chinese system number, and about twice the analyst US “system” figure, because they are measuring different things.
This is why I am cautious with BNEF and Wood Mackenzie for US work. Their figures are not wrong, but they are global or modeled averages of a lower layer in the stack, and they reach you six to twelve months after the fact. For a US project, they systematically understate what you will actually pay, because they do not carry US interconnection queues, US labor, US soft costs, or US tariffs.
The part the forecasts keep missing: US costs went up
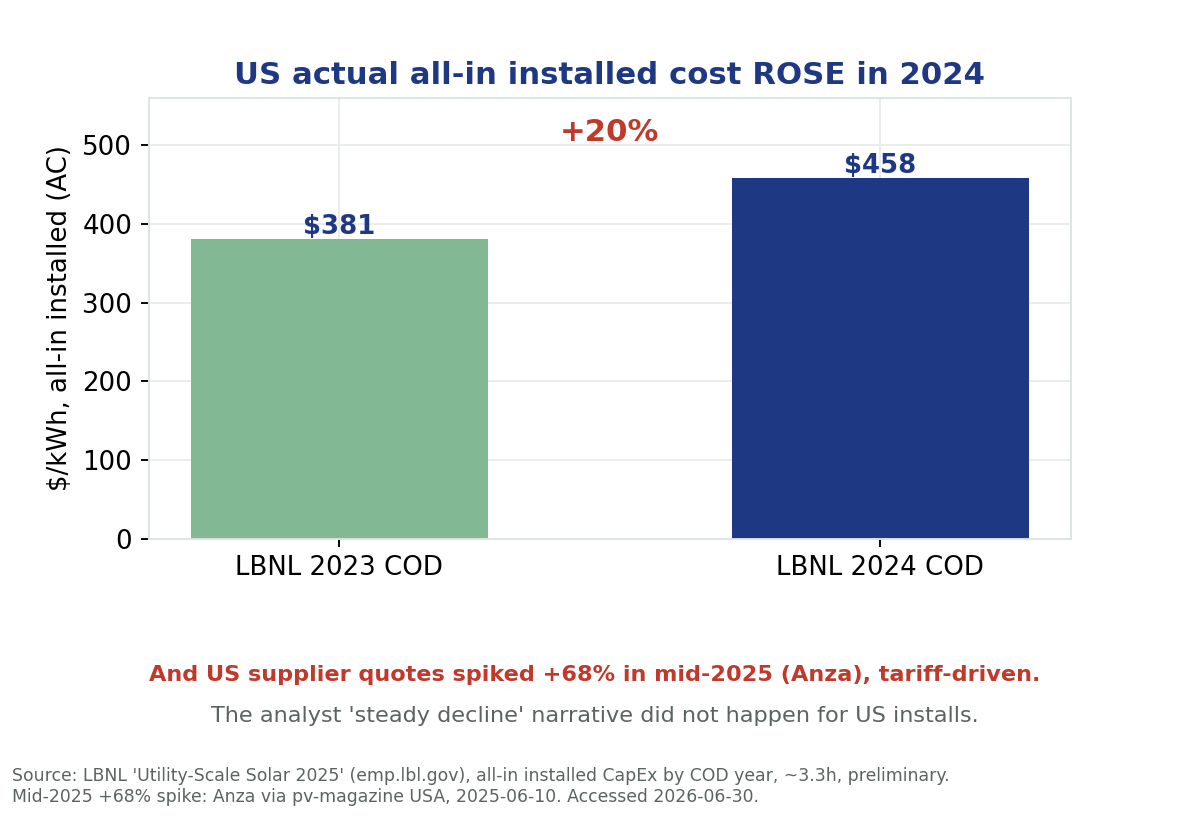
If the analyst story were the whole story, US installed costs would have kept gliding down. They did not. LBNL’s actual all-in installed figure rose 20% in a single year, from $381/kWh in 2023 to $458/kWh in 2024. And supplier quotes did something more violent: the Anza index shows US distributed-storage prices spiked about 68% in Q2 2025, the sharpest jump since 2021 (Anza via pv-magazine USA, 10 June 2025).
What this means for the next two to three years
- Anchor to actual installed cost, not survey averages. Budget a US utility-scale 4-hour project in the $330 to $460/kWh all-in installed range today, using NREL, EIA, and LBNL as goalposts, and treat any sub-$200/kWh figure as equipment-only or non-US until proven otherwise.
- Cheap global cells help the block, not the bill. Falling Chinese cell prices flow into the DC block, but tariffs, interconnection, and soft costs sit on top and dominate the all-in number. The two move independently.
- Trade policy is the swing factor, not chemistry. Section 301, antidumping and countervailing duties, and domestic-content rules drive the US cost path more than any cell breakthrough this window. Domestic content (45X) is the main lever pushing the other way.
- Interconnection and timing are cost. A queue delay or scope change moves the installed number more than a 10% cell move. Plan procurement and interconnection together.
Sources
- U.S. EIA, Battery Storage in the United States / Form EIA-860 (installed cost $396/kWh, 2022), 17 March 2026.
- LBNL, Utility-Scale Solar 2025 Edition (all-in installed $381/kWh 2023, $458/kWh 2024), Oct 2025.
- NREL ATB / 2025 Update (4-hour benchmark $334/kWh, 2024$).
- Anza procurement index via Utility Dive (AC $203 / DC $175 per kWh, Q1 2026), 7 April 2026.
- Anza via pv-magazine USA (US storage prices +68%, Q2 2025), 10 June 2025.
- Tesla Megapack pricing (hardware ~$224-266/kWh; installed ~$290/kWh), 2024-2025.
- White & Case, Section 301 tariff update (Chinese storage cells to 25%, eff. 1 Jan 2026).
- Clean Energy Associates via ESS-News (US BESS from China +35% in 2025), 14 Jan 2025.
- BloombergNEF system survey via Energy-Storage.news (China $73 / US $219 / global $117 per kWh); analyst comparison, 16 Dec 2025.
- Wood Mackenzie APAC storage pricing report; analyst comparison, 14 Oct 2025.
- Seed video: The Electric Viking, YouTube, 29 June 2026 (claims flagged; not used as fact).