What exists now, what is coming, and how a developer-owner makes money in the country's hottest capacity market.
Goal of this analysis
Determine what battery storage opportunities exist in PJM today and over the next several years, and identify the levers that move a project from marginal to investable.
Analysis dated 15 July 2026 · Charts and figures added 3 August 2026 (no analytical changes) · Developer / investor lens · Every figure carries a cited source. VERIFIED = primary source; ESTIMATE = modeled or triangulated.
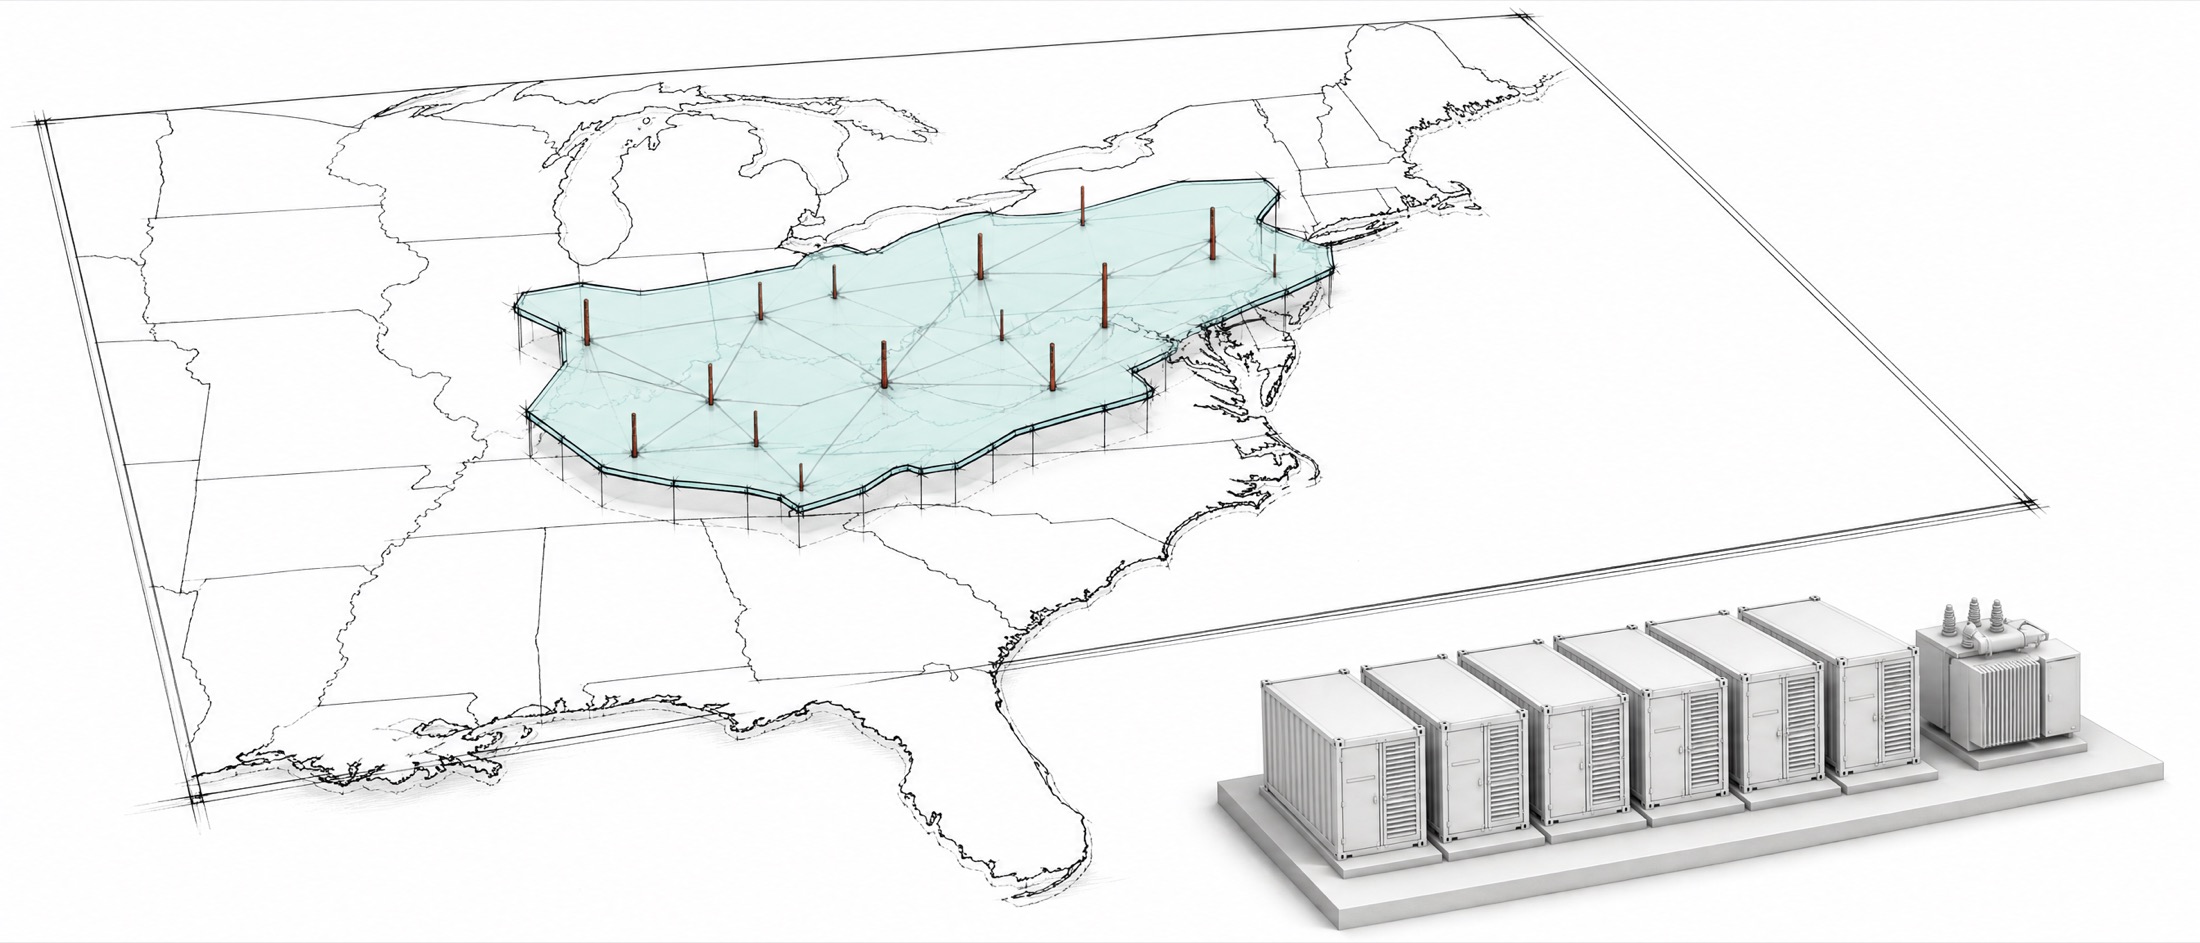
Diagrammatic illustration, not a service-territory map. The raised panel indicates the PJM footprint conceptually; boundaries, nodes, and transmission lines are illustrative and are not survey-accurate. PJM's actual territory covers all or part of 13 states plus the District of Columbia: Delaware, Illinois, Indiana, Kentucky, Maryland, Michigan, New Jersey, North Carolina, Ohio, Pennsylvania, Tennessee, Virginia and West Virginia. ILLUSTRATION Produced for this report; verify any footprint question against PJM's own territory map at pjm.com.
Read first
The seven things that matter
1
Capacity prices have repriced roughly 11x in three years, $28.92 → $329.17 → $333.44 per MW-day, and the last two auctions both cleared at the FERC-approved cap. This is the single biggest tailwind for a PJM battery.
2
Yet PJM has almost no batteries operating (~0.4–0.7 GW) versus ~25 GW across ERCOT and CAISO. The runway is enormous and largely empty.
3
Data centers are driving more than 100% of near-term load growth. Without them PJM's peak would be flat-to-shrinking; the most recent auction cleared ~6.6 GW short of the reliability requirement.
4
Four revenue streams stack: capacity, energy arbitrage, frequency regulation, and reserves. A well-sited 4-hour battery is benchmarking ~$288–304/kW-yr on recent run-rates, though that reflects an exceptional 2025 price environment.
5
Timing is gated by interconnection. A plain-vanilla new project is a ~2030–2032 story. The shortcuts: buy an already-studied queue position, or co-locate behind existing rights using Surplus Interconnection Service.
6
Merchant economics are real but thin on their own; the state incentive is what makes them investable. A New Jersey GSESP award flips the flagship 100 MW / 4-hr case from −$28.7M to +$35.5M NPV (5.4% to 11.1% IRR). The 30% federal ITC is not available for this strategy (see note below).
7
Best states right now: New Jersey (live incentive auctions), Maryland (1,600 MW mandate), Virginia (expanded VCEA + data-center epicenter). Even no-mandate states (PA, OH) work on capacity-market strength alone.
The setup
Why PJM, why now
Three forces have converged: a capacity market that has repriced by an order of magnitude, demand growth that is structurally driven by data centers, and a storage fleet that has barely started to build.
$329/MW-day
2026/27 capacity clearing price (at the cap), +22% YoY
PJM 2026/27 BRA Report VERIFIED
$16.1B
Total 2026/27 capacity auction cost (+9.5%)
PJM 2026/27 BRA Report VERIFIED
~0.4–0.7GW
Operating battery capacity in PJM today
Modo Energy / Cleanview ESTIMATE
66.5GW
Standalone storage in PJM's new Cycle 1 queue
PJM Inside Lines, Apr 2026 VERIFIED
Source: PJM Base Residual Auction Reports for 2025/26, 2026/27, 2027/28 (pjm.com), accessed 15 Jul 2026. VERIFIED
These bars are four different quantities on one axis, not one time series. Operating capacity is what exists; the requirement bars are what PJM is assessed to need; the queue bar is applications, and historically only a fraction of any queue is built. The gap between the first bar and the third is the opportunity this report is about.
Sources: operating fleet, Modo Energy / Cleanview ESTIMATE; 2030 forecast, Modo Energy ESTIMATE; 2032 and 2045 requirements, Brattle via Utility Dive VERIFIED; queue, PJM Inside Lines Cycle 1 window closed 27 Apr 2026 VERIFIED. All accessed 15 Jul 2026.
The demand engine. PJM's 2026 Long-Term Load Forecast has summer peak rising from ~160 GW (2025) to ~253 GW by 2046, with the near-term 10-year growth rate raised to 3.6%/yr. Between 2026 and 2031, data centers account for ~35.1 GW of ~34.6 GW of total growth, over 100%. Reserve margins are tightening: the 2027/28 auction cleared ~6.6 GW short of the reliability requirement.
PJM co-optimizes energy, regulation, and reserves in a single dispatch; capacity is a separate forward obligation. A battery stacks all four. Figures below are for a 4-hour system, per kW-year.
Stream
What it is
Conservative
Strong / recent
Basis & source
Capacity (RPM)
Forward payment for being available at peak; accredited via ELCC
$49–60
$60+
PJM BRA price × 50% ELCC × 365 VERIFIED
Energy arbitrage
Buy low / sell high on the day-ahead & real-time spread (TB4)
$40–60
$69+ gross
Modo TB4: $47 (2024) → $69 (2025), ~$112 by 2030 ESTIMATE
Frequency regulation
RegD fast signal, batteries' historical stronghold
Read the widths, not just the positions. Regulation is by far the widest bar, which is the same as saying it is the least reliable line in the model: it is both the biggest earner and the one that has already collapsed once. The all-in range is deliberately narrower than the sum of the four highs, because the streams do not peak in the same year.
Sources as per the table above: PJM BRA price × 50% ELCC × 365; Modo Energy TB4 spread and PJM benchmark; Monitoring Analytics 2024 State of the Market, Sec. 10. Component ranges and all-in benchmark are ESTIMATE except the capacity calculation basis VERIFIED. Accessed 15 Jul 2026.
Capacity is the anchor, and the story
Storage is accredited on a marginal ELCC basis. For the 2026/27 auction, PJM rates a 4-hour battery at 50% of nameplate, a 6-hour at 58%, 8-hour at 62%, and 10-hour at 72%. Because accreditation is marginal, short-duration ratings decline as storage saturates, which is why the market is pushing developers toward longer duration.
Source: PJM ELCC Class Ratings for the 2026/2027 BRA (pjm.com), accessed 15 Jul 2026. VERIFIED, note several trade-press figures circulating are wrong; these are the official ratings. Ratings shown are for the 2026/27 auction only and decline as storage saturates, because accreditation is marginal.
Regulation: real money, real saturation risk
RegD is where batteries have always earned the most, and 2024–25 prices rose sharply (2024 clearing +40% YoY). But the requirement is small (~525–800 MW) and the market saturated once before, RegD prices fell roughly two-thirds after the 2014 build-out. The 2024–25 rise is a cyclical rebound, not a structural repeal. Do not underwrite to today's peak.
Source: Monitoring Analytics 2024 State of the Market, Sec. 10; Utility Dive. VERIFIED
Getting connected
Interconnection and timing, the real gate
Revenue is attractive; the binding constraint is getting steel in the ground. PJM has overhauled its queue, and a set of shortcuts is emerging.
Queue reform: PJM moved from a serial first-come queue to a cluster "Cycle" process. Transition Cycle 1 finished Nov 2025 (84 projects / 14.3 GW, incl. 21 storage projects / 1.9 GW); the final legacy group (TC2) executes agreements in Q1 2027. VERIFIED
The storage flood: the first true new "Cycle 1" window closed 27 Apr 2026 with 811 projects / 220 GW, storage was the largest technology by count: 349 standalone (66.5 GW) + 45 solar-storage hybrids (8.9 GW). VERIFIED
Faster agreements: PJM now targets a 1–2 year Generation Interconnection Agreement, versus 2–4+ years historically. The GIA is not the commercial operation date, build follows. VERIFIED
Reliability Resource Initiative (RRI): a one-time fast-track selected 51 projects / 9,361 MW in May 2025, including 5 batteries (~2,275 MW). VERIFIED
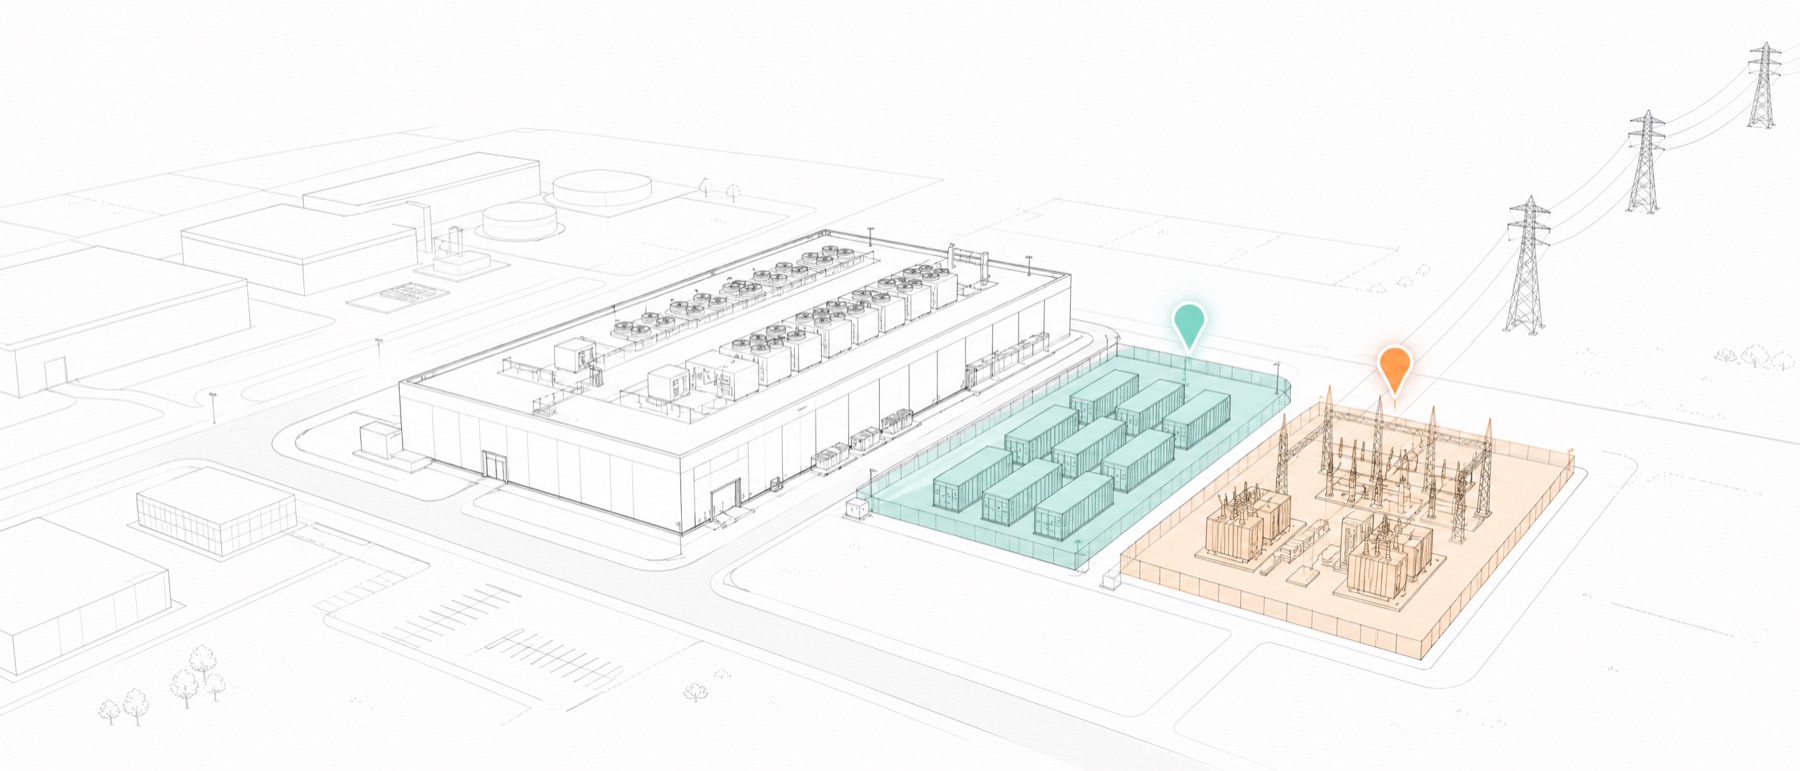
The shortcut, co-location + Surplus Interconnection Service: FERC's 18 Dec 2025 order (Docket EL25-49) forces PJM to let generators use SIS to serve co-located load (data centers) and to skip the full queue where no network upgrades are triggered. This is the single biggest timeline differentiator right now. VERIFIED
Three doors onto the grid
Development and interconnectionCommercial operation window
The revenue case is roughly the same down all three routes. The difference is years, and years are what decide whether a project catches today's capacity prices or someone else's. This is why route selection, not siting, is the first decision.
Sources: PJM Inside Lines; Modo Energy; K&L Gates and Blank Rome analyses of FERC Docket EL25-49 (order issued 18 Dec 2025), accessed 15 Jul 2026. Timelines are ESTIMATE; the co-location route remains pending PJM's final compliance tariff.The structure the FERC order unlocks: storage (teal) sited beside data-center load, sharing the existing interconnection rights at the substation (orange) rather than taking a new queue position. Illustration produced for this report; diagrammatic, not a specific site.
Realistic time-to-COD for a project started today: a plain-vanilla new build is ~2030–2032 (4–6 years). Buying an already-studied Fast Lane / TC1 position targets 2027–2029. A co-location / SIS structure behind existing rights, with no upgrades, can compress to ~2–3 years, pending PJM's final compliance tariff.
Sources: PJM Inside Lines; Modo Energy; K&L Gates and Blank Rome analyses of FERC Docket EL25-49 (accessed 15 Jul 2026). VERIFIED
Where to build
State-by-state opportunity
PJM-wide capacity prices lift merchant economics everywhere, but state programs decide where the incentive money and mandates are. Ranked for a developer.
State
Status
Instrument
The number
What it means for a developer
New JerseyLIVE
Awarding now
Garden State Energy Storage Program (GSESP)
Tranche 1 = 355 MW awarded Mar 2026; Tranche 2 (645 MW) open, bids due 7 Aug 2026
Total program / mandateNear-term procurable or reachable slice
Bar length is not opportunity. Virginia is the largest number and the slowest clock (2045); New Jersey is the smallest and the only one with a bid date inside this quarter. Target the dark segments, not the long bars.
Sources: NJ BPU orders (Docket QO22080540) & Utility Dive; MD PSC / Next Generation Energy Act 2025; VA enrolled HB2537 & JLARC Report 598; IL Public Act 104-0458 / Illinois Power Agency; PA PUC AEPS; OH HB15. All accessed 15 Jul 2026. VERIFIED program volumes; the Virginia 1,827 MW figure is the stated 35% floor applied to 5,220 MW ESTIMATE (arithmetic, not a procurement commitment).
Sources: NJ BPU orders & Utility Dive; MD PSC / NGEA; VA enrolled HB2537 & JLARC Report 598; IL Public Act 104-0458 / IPA; PA PUC; OH HB15 (Kroll, Dickinson Wright). All accessed 15 Jul 2026.
Federal overlay
Why this analysis does not use the ITC
Important: no ITC in this analysis
Every number in this report and the accompanying pro forma excludes the 30% federal Investment Tax Credit. Not as a modeling preference, but because there is no credible FEOC-compliant battery manufacturer at competitive pricing as of mid-2026. The domestic products marketed as "FEOC-compliant" are 2027 promises that price above a Chinese LFP battery even with the full US tariff stack added, and disclose no cell or cathode origin. The affordable, available battery in this strategy is Chinese-content, which fails FEOC, so the credit is simply off the table.
The credit exists in law
Under the 2025 OBBBA, standalone storage was carved out of the wind and solar cliff and stays on the §48E schedule: base 6%, up to 30% with prevailing-wage and apprenticeship. So on paper the credit is available to storage.
But FEOC is a hard gate, and the hardware to clear it is not competitive
Eligibility requires ≥55% non-prohibited-foreign (non-China) content in 2026, pass/fail. Checking the manufacturers directly (eticaag.com, agbess.com), the "FEOC-compliant" products are future (2027) with no cell-origin proof, and cost more than a tariffed Chinese battery. So the credit is unreachable at a net gain today.
Also on the radar: the Section 301 tariff on Chinese grid batteries rose from 7.5% to 25% effective 1 Jan 2026 (roughly +15–20% on delivered cell cost), and even so the Chinese battery undercuts the domestic FEOC-compliant options. FERC Order 841 (storage in wholesale markets) is fully live in PJM; Order 2222 (DER aggregation) has slipped to a proposed Feb 2028 go-live.
Sources: Morgan Lewis; FERC; Renewable Energy World. VERIFIED
The economics
What the numbers say
We modeled four configurations, 20 MW and 100 MW, each at 4-hour and 2-hour duration, as unlevered, pre-tax, merchant projects on gross CAPEX with no ITC, at an 8% discount rate and a ~2030 COD. Full live-formula model in the accompanying workbook.
Configuration
Installed CAPEX
Yr-1 revenue ($/kW-yr)
NPV @ 8%
IRR
Simple payback
20 MW / 4-hr
$34.5M
$226
−$7.6M
4.7%
11.2 yr
100 MW / 4-hr (flagship)
$164.5M
$226
−$28.7M
5.4%
10.6 yr
20 MW / 2-hr
$23.0M
$192
−$0.05M
8.0%
8.4 yr
100 MW / 2-hr
$109.8M
$192
+$5.7M
8.8%
8.0 yr
Source: PJM_BESS_ProForma_v2.xlsx, live-formula model, results verified via recalculation 15 Jul 2026. No ITC. Revenue assumptions triangulated from PJM, Monitoring Analytics, and Modo Energy; cost assumptions from NREL/TP-6A40-93281 and Lazard LCOS v10. ESTIMATE (model output).
Three of the four configurations do not clear an 8% hurdle on merchant revenue alone. All four clear it comfortably with the New Jersey incentive. With the federal ITC unavailable, this chart is the argument for leading with a state program rather than a merchant site: the incentive is not an enhancement to the deal, it is the deal.
Source: PJM_BESS_ProForma_v2.xlsx, live-formula model, results verified via recalculation 15 Jul 2026. ESTIMATE (model output). GSESP modeled at $75k/MW-nameplate-yr for 15 years, within the $60k–82k/MW-yr range of actual NJ awards; additive mechanic verified from NJ BPU Order 18 Jun 2025, Docket QO22080540.
Two findings worth pausing on
On a pure merchant basis, 2-hr out-returns 4-hr. Regulation is power-based, so it pays the same for both durations, while 4-hr costs roughly twice the energy CAPEX. The 4-hour's real edge is capacity accreditation (50% vs ~35% ELCC), a hedge against future long-duration value, and eligibility for programs that require ≥4-hour (Maryland).
Scale helps. The 100 MW cases spread fixed development and O&M over more MW, lifting IRR versus the 20 MW twins.
The New Jersey incentive is what makes it investable
With the ITC unavailable, the state program is the lever. New Jersey's GSESP fixed payment stacks additively on PJM revenue for 15 years (verified from the order: no offset, no clawback). It flips every case strongly positive:
Configuration
Base NPV / IRR
+ NJ GSESP NPV / IRR
20 MW / 4-hr
−$7.6M / 4.7%
+$5.3M / 10.2%
100 MW / 4-hr
−$28.7M / 5.4%
+$35.5M / 11.1%
20 MW / 2-hr
−$0.05M / 8.0%
+$12.8M / 15.8%
100 MW / 2-hr
+$5.7M / 8.8%
+$69.9M / 16.9%
NJ awards ran $60k–82k/MW-nameplate-yr; model uses $75k. Additive mechanic verified from the order text. Source: NJ BPU Order 18 Jun 2025, Docket QO22080540; pro forma Scenarios tab. VERIFIED mechanic, ESTIMATE rate.
Bottom line on economics. Merchant-only PJM storage is a thin-margin proposition at an 8% hurdle, an honest floor, not a forecast. With the ITC off the table, the New Jersey incentive is the decisive lever: it flips the flagship case from −$28.7M to +$35.5M NPV and lifts IRR from 5.4% to 11.1%. Capacity revenue and co-location (which cuts cost and years) do the rest. The strategy lives or dies on the state program, not the tax credit.
Recommendation
How to play PJM
Lead where the money is live: New Jersey's GSESP Tranche 2 (bids due 7 Aug 2026) and Maryland's NGEA rounds offer fixed, multi-year revenue that de-risks the merchant stack. These are the near-term targets.
Anchor on 4-hour for programs, evaluate 2-hour for pure merchant. Maryland requires ≥4-hour; capacity value rewards it. But where the play is merchant regulation + arbitrage, a 2-hour system is more capital-efficient.
Chase co-location. The FERC SIS order is the fastest path onto the grid and cuts interconnection cost and years off the timeline, especially adjacent to the data-center load driving the whole market.
Underwrite conservatively on ancillary. Regulation is the swing factor and it saturates. Build the base case below today's run-rate; treat the peak as upside.
Do not underwrite to the ITC. It is unreachable at competitive pricing today, so the deal must pencil on merchant revenue plus a state incentive alone. Revisit only if a genuinely FEOC-compliant battery reaches price parity.
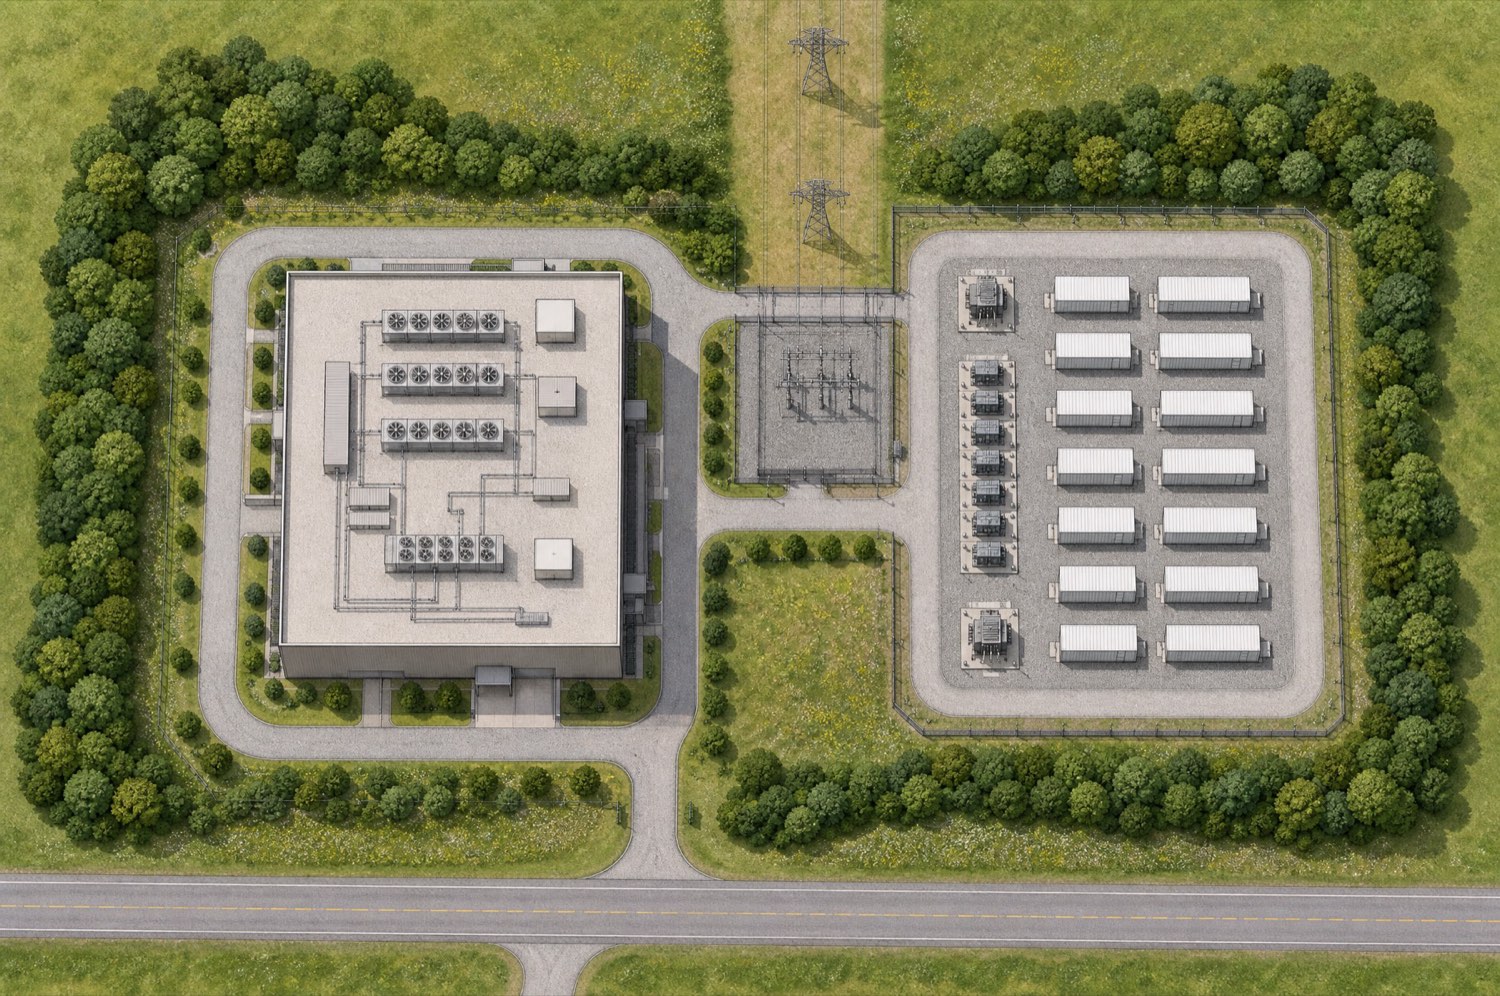
What "chase co-location" looks like on the ground: the battery compound and the data center meet at a shared switchyard on one set of interconnection rights, with the transmission corridor already in place. No new queue position, no network upgrades, which is the condition the FERC order attaches to the fast path. Illustration produced for this report; diagrammatic, not a specific site, and container count does not imply a rating.
The next five years
Outlook to 2030
~7GW
PJM operating storage by 2030 (Modo), a ~17x jump
Modo Energy ESTIMATE
16GW
Storage PJM needs by 2032 (Brattle resource adequacy)
Brattle via Utility Dive VERIFIED
43GW
Storage PJM needs by 2045 (Brattle)
Brattle via Utility Dive VERIFIED
~$112k/MW-yr
Forecast 4-hr arbitrage spread by 2030 (highest of Eastern ISOs)
Modo Energy ESTIMATE
The direction is unambiguous: PJM is structurally short of capacity, demand is climbing on data centers, and storage is the fastest resource to build. The open questions are price durability (does the capacity cap hold or lift after 2027/28; how fast does regulation saturate) and execution (interconnection throughput and FEOC-compliant supply). For a developer who can move now, via a live state program, an already-studied position, or a co-location structure, the window is wide and largely uncontested.
Energy & ancillary: Monitoring Analytics 2024 State of the Market Report for PJM (Sec. 10); Modo Energy PJM benchmark, TB4 spread and outlook research.
State policy: NJ BPU orders (Docket QO22080540) & Utility Dive; MD PSC / Next Generation Energy Act & Saul Ewing; VA enrolled HB2537 & JLARC Report 598; IL Public Act 104-0458 / Illinois Power Agency; PA PUC AEPS; OH HB15 (Kroll, Dickinson Wright).
Federal: IRS Clean Electricity Investment Credit & Notice 2026-15/IR-2026-23; Kirkland & Ellis, Williams Mullen, projectfinance.law (OBBBA/FEOC); Morgan Lewis (Section 301 tariff); FERC (Orders 841 & 2222).
Costs: NREL/TP-6A40-93281, "Cost Projections for Utility-Scale Battery Storage: 2025 Update"; Lazard LCOE+ June 2025 (LCOS v10).
All web sources accessed 15 July 2026. Full URLs are recorded in the accompanying master data file and in the pro forma's Sources tab. Figures marked VERIFIED are drawn from primary documents; those marked ESTIMATE are modeled or triangulated and labeled at the point of use.